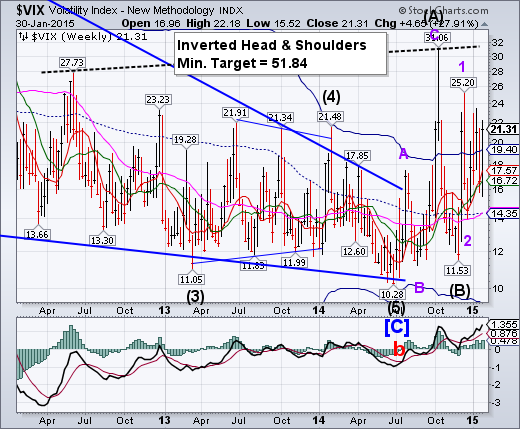
-- VIX closed clearly above its Cycle Top resistance at 19.40 and is poised for a potential breakout above its October 15 high. The Cycles Model projects a probable rally top by mid- February. It may get very exciting.
SPX lost key support at 2000.00.
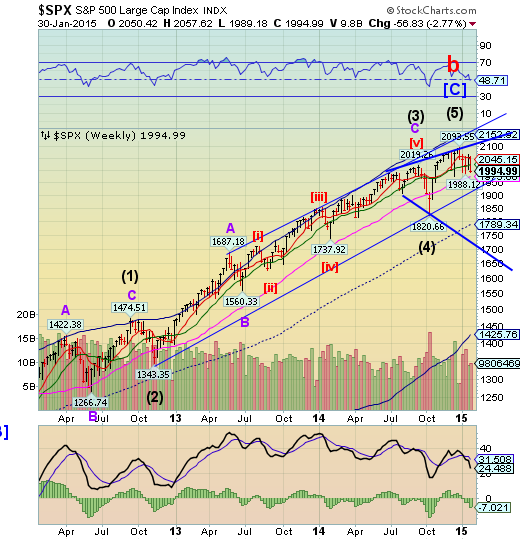
SPX just had its lowest weekly close of the year. The next critical support is the weekly Long-term support at 1973.66.It appears to be progressing within the Orthodox Broadening Top pattern with Point 6 in its sights, beneath its lower trendline near 1700.00.
(ZeroHedge) In a somewhat stunning admission of the truth in central planning (that the Swiss just experienced first hand - and perhaps Venezuela has been experiencing for years), The Philly Fed's Charles Plosser explains the following...
"It may work out just fine, but there’s a risk to that strategy, and the risk is that we wait until the point where markets force us to raise rates and then we have to react quickly and aggressively. I believe that if we wait too long, then we run the risk of falling very far behind the curve or disrupting the economy by rapid rate increases.
NDX closed beneath Intermediate-term support.
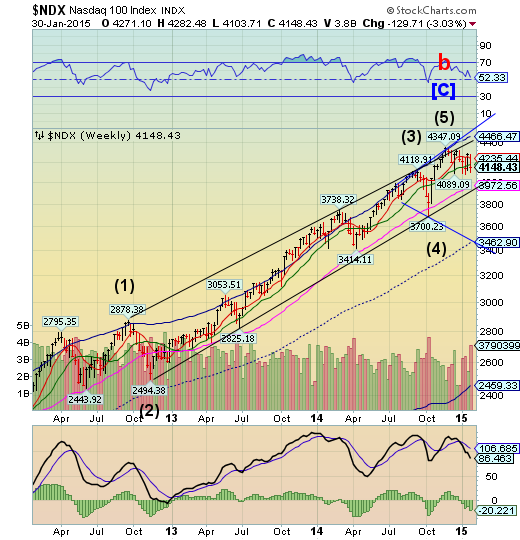
NDX closed beneath Intermediate-term support at 4175.30 and the lower range of its trading pattern. The next critical support is the weekly Long-term support at 3972.56 and beneath that is the 3-year trading channel trendline. There are approximately 2 more weeks of possible decline in this cycle and a lot may happen in that time span.
(MarketWatch) — U.S. stocks ended a turbulent Friday trading session with big losses, as selling on Wall Street accelerated in the final hour.
Investors grappled with downbeat gross domestic product data, less-than-stellar earnings that overshadowed a bounce in crude-oil futures.
A slower-than-expected economic growth number resulted in a flight to quality, with investors flocking into havens such as Treasurys and gold and unloading equities.
Crude oil prices swung higher Friday, settling at $48.24 a barrel, driven by a big drop in U.S. rig counts as producers responded to oversupply. Oil also got a boost as traders ended bets that the price of oil will see a continued slide.
The main indexes ended January with the biggest monthly losses in a year, while also recording a weekly decline, which marked the fourth weekly drop out of past five.
High Yield breaks beneath its Diamond Formation.
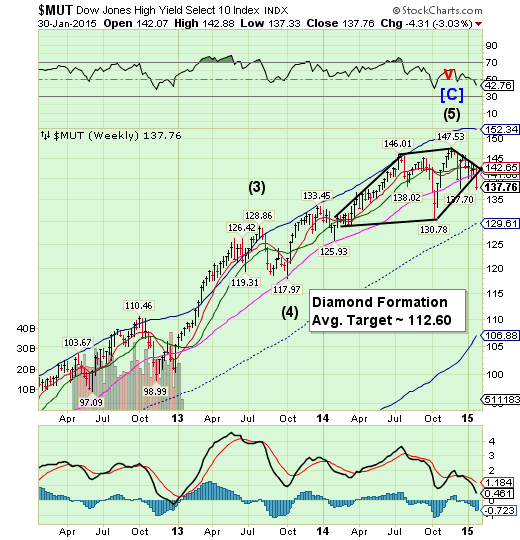
The High Yield Index has broken down beneath the lower trendline of a Diamond Formation which forecasts a probable decline to its Cycle Bottom at 106.88. We now have directionality in our future expectations.The decline may last through mid-February, according to the Cycles Model.
(WSJ) U.S. junk-bond investors are showing fresh caution, renewing concerns of a wholesale retreat that could hobble financing for low-rated companies and hamstring the economic recovery.
On Monday, information-technology company Presidio Inc., which is being purchased by affiliates of private-equity firm Apollo Global Management LLC, postponed a $400 million bond sale due to lack of demand, according to people familiar with the matter. A planned $400 million sale was scrapped by materials and chemicals company Koppers Holdings Inc (NYSE:KOP) last week, according to S&P Capital IQ LCD. Koppers said last week that it “can afford to be patient, as this offering was opportunistic in nature.”
The euro bounced, but may not have made its Cycle low.
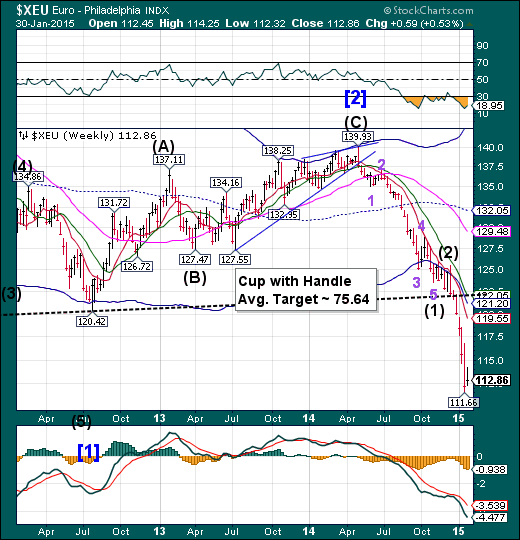
The euro bounced this week, but may have a later date in mind for its Cycle Bottom.The euro anticipates its next Master Cycle low in early-to-mid February, so it may fall quite a distance in the interim. There is some discussion whether may see parity between the euro and the dollar before this is over.
(ZeroHedge) As eurogroup chief Jeroen Dijsselbloem (of "template" foot in mouth infamy) heads to Athens for talks today,Bloomberg reports the new Greek Finance Minister Yanis Varoufakis has a clear message for his European overlords of the past: “We don’t want the 7 billion euros...We want to sit down and rethink the whole program." While this exposes the nation's banking system to further runs, yesterday's revelation that Russia could step in with financing should they need it, leaves Dijsselbloem and Shulz with less and less leverage even as Spain's chief economic advisor warns, if Greece doesn't play along, "there will be problems on all fronts."
EuroStoxx repelled by its Cycle Top.
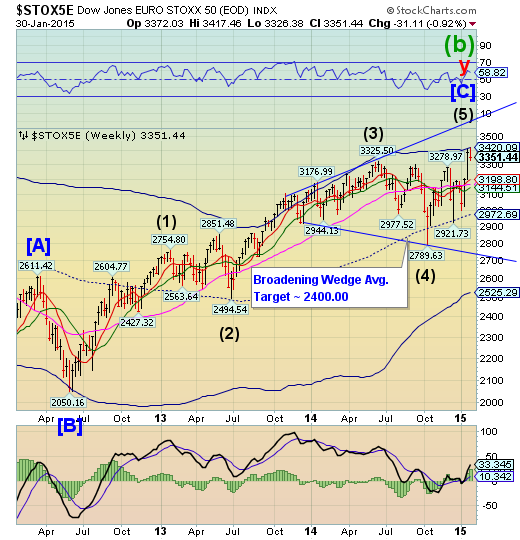
The EuroStoxx 50 Index unfortunately could not go beyond its Cycle Top resistance at 3420.09. Last week I had suggested that the Cycles Model suggested that EuroStoxx may not go above its Cycle Top. The Model now suggests the next low may come mid-February.
(MarketWatch) — European stocks fell Friday, with data highlighting the European Central Bank’s troubles with low inflation levels, but the region’s equity benchmark was still on track for its best monthly performance in more than three years.
The euro EUR/USD, -0.27% , meanwhile, fell against the dollar heading into the weekend following reports of a rough start in negotiations between Greece and its creditors.
Stocks on Friday declined after European Union data showed eurozone consumer prices were 0.6% lower than in January 2014, marking the largest decline in prices since July 2009. The tumble in energy prices was a significant factor driving the reading lower.
The yen cautiously rises.
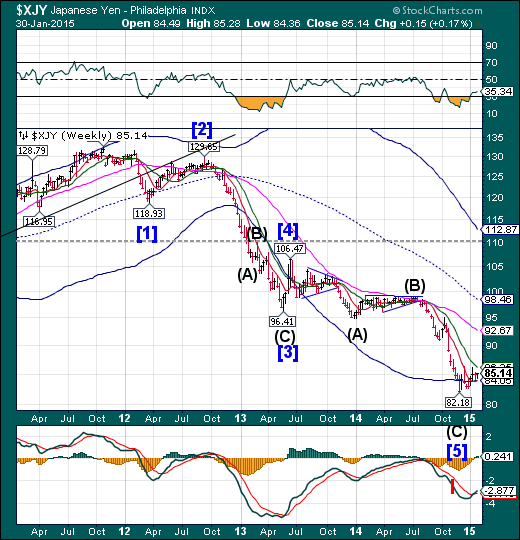
The yen cautiously moved higher above support provided by its Cycle Bottom at 84.06. It has yet to overcome its December 16 high at 86.34. Once the breakout occurs, the yen may gain momentum in its rally, since most traders have not recognized a change of trend…yet.
(Bloomberg) -- The yen gained against all but one major counterparts after the U.S. economy expanded at a slower pace than forecast in the fourth quarter, fanning speculation growth is being hindered by a global slowdown.
Only Norway’s krone gained versus Japan’s currency after that nation’s central bank said it will increase daily currency purchases. The ruble tumbled as much as 4.5 percent as Russia’s central back unexpectedly cut interest rates, joining peers across the globe in enacting new stimulus measures this year. Emerging-market currencies slumped to the lowest in more than 20 years, led by Brazil’s real, while stocks dropped and Treasuries rose with global bonds.
The Nikkei was positive, but no new highs.
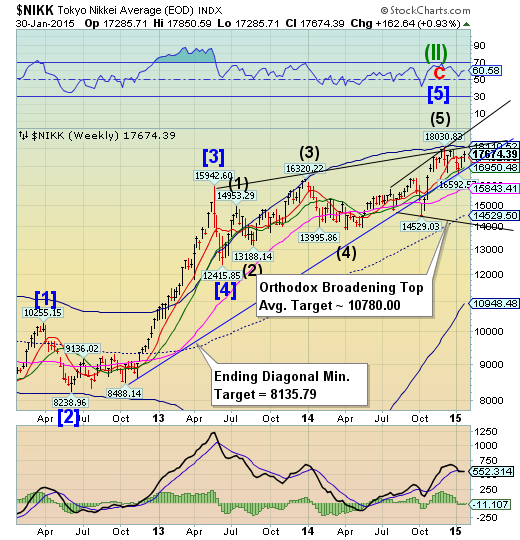
The Nikkei made a Primary cycle high on Tuesday and now appears ready to make a potential 2 week decline into a Trading Cycle low. It is difficult to say how many supports may be breached, but the most important one is the 2-year trendline at weekly Intermediate-term support at 16950.48. The Orthodox Broadening Top may follow quickly, since it represents a market that is out of control and has a highly emotional public participation.This may be the start of a dramatic decline that is imminently due.
(Bloomberg) -- Japanese stocks rose for a second week as investor sentiment recovered amid expectations of slower interest-rate increases in the U.S. despite growing confidence in the world’s largest economy.
Toshiba Corp. (TOKYO:6502) gained 2.3 percent after reporting an 86 percent jump in net income. Advantest Corp. (TOKYO:6857), a chip manufacturer, added 9.3 percent after boosting its profit forecast. Computer maker NEC Corp. (TOKYO:6701) tumbled 7.5 percent as its operating profit missed estimates. Softbank Corp. (TOKYO:9984) lost 3.5 percent to be the biggest drag on the Nikkei 225 Stock Average after Alibaba Group Holdings Ltd (NYSE:BABA), of which it owns 32 percent, missed sales estimates.
The TOPIX added 0.1 percent to 1,415.07 at the close in Tokyo, gaining 0.8 percent this week and 0.5 percent in January. Two stocks advanced for each that fell. The Nikkei 225 Stock Average rose 0.4 percent to 17,674.39.
US dollar pauses before its final push higher.
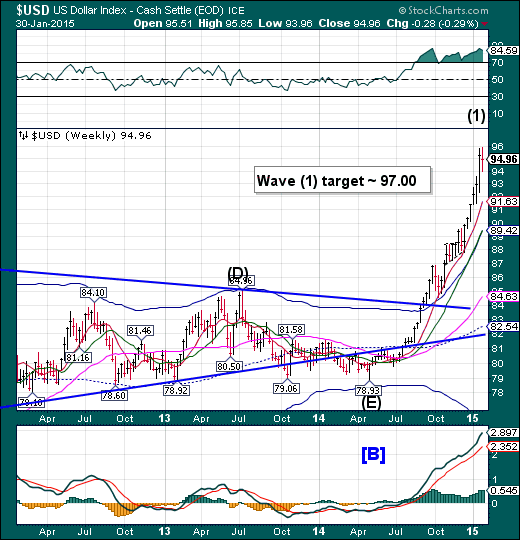
The US dollar paused this week to regroup prior to its final push toward its near-term target of 97.00. The Cycles Model suggests that there may be a Primary Cycle high due in the first or second week of February. A sharp retracement may follow, lasting approximately a month or longer.
(Reuters) - The dollar traded mixed on Friday after weaker-than-expected headline U.S. fourth-quarter gross domestic product data, which included the fastest pace of consumer spending since 2006 and left intact market expectations of long-term greenback gains.
U.S. economic activity in the fourth quarter rose 2.6 percent, below economists' consensus forecast of 3 percent and nearly half of the third quarter's 5 percent rate.
While the U.S. Federal Reserve is still expected to begin raising interest rates later this year, the contrast with loosening monetary policies elsewhere in the world is becoming even more stark.
USB in final probe of Wave 3.
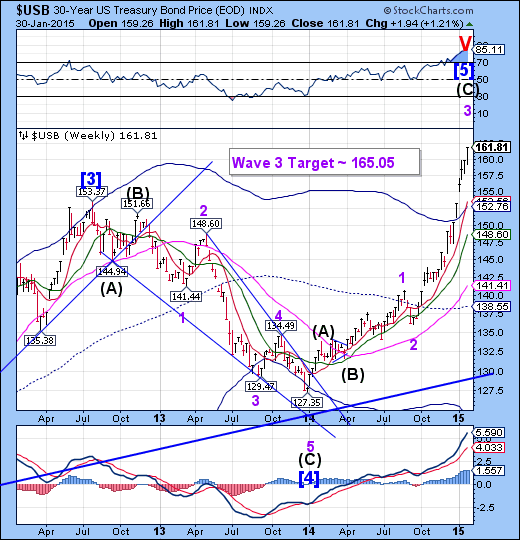
The Long Bond may have begun the final probe higher of Wave 3. The final thrust may end as early as next week. A month-long correction may ensue before Wave 5 is underway. This is getting to be a very crowded trade and may make a strong reversal when it happens.
(BusinessInsider) “If it ain’t broke, don’t fix it,” says my friend Gary Shilling as he kicks off today’s Outside the Box.
He’s referring to his investment themes for 2015. He first gives us 11 reasons to continue favoring long Treasury bonds. That’s an obvious play for him if you know his view, but it’s nevertheless a compelling one this year and one that you should think through, given the specter of deflation about in the world, the firing up of QE in Japan and Europe (which gives folks money to buy … Treasurys), and the safe-haven status of the US dollar.
Gold declines, then retraces 52%.
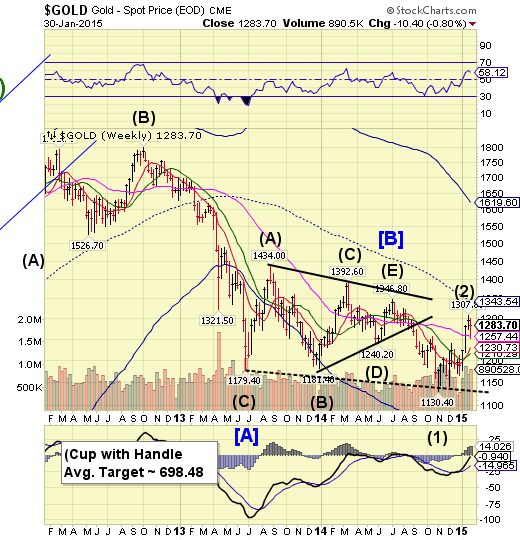
Gold declined by 50 points this week, followed by a 52% retracement. Gold appears to be capable of resuming a decline that may challenge the Lip of the Cup with Handle formation by mid-February.
(Bloomberg) -- Gold futures rose, capping the biggest monthly gain in three years, after U.S. government data showed the economy expanded at a slower pace than forecast in the fourth quarter, reigniting demand for the metal as a haven.
A widening trade gap limited expansion for gross domestic product as imports climbed three times faster than exports, Commerce Department figures showed. The metal extended gains as U.S. equities fell on economic concerns, adding to gold’s appeal as an alternative investment.
Futures rose the most in two weeks amid speculation that weaker foreign economies will be a drag on American growth, prompting the Federal Reserve to wait longer before raising interest rates. Assets in global exchange-traded products backed by gold climbed for 10 straight sessions to the highest since October, data compiled by Bloomberg show.
Crude may need further consolidation.
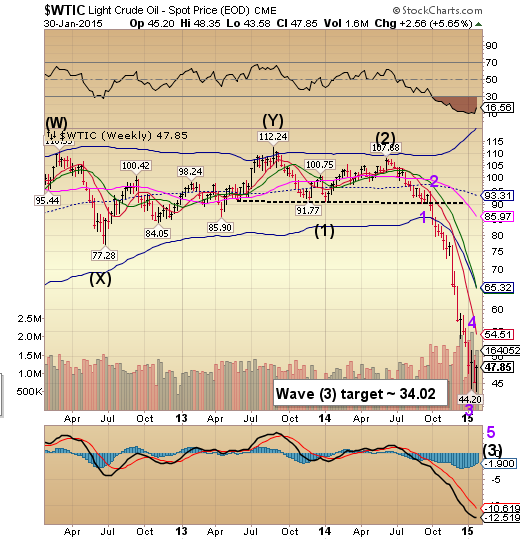
Crude began what may be a week-long rally before the next phase of its decline. Crude may need a retest of its Short-term resistance, currently at 54.51 before restarting its decline. This rally may shake out the weaker short positions before the decline resumes.
(WSJ) U.S. oil prices surged more than 8% Friday as traders jettisoned bearish bets against the market after data showed a steep drop in the number of rigs drilling for oil in the country—a sign the wave of crude may be starting to ebb.
The news of falling domestic production facilities came against a backdrop of otherwise bearish supply-and-demand fundamentals and macroeconomic indicators on Friday, including a continued widening gap between production and consumption for oil from the Organization of the Petroleum Exporting Countries and a weaker-than-expected reading on fourth-quarter U.S. economic growth. Indeed, many analysts believe oil prices have further to fall as global production continues to outpace demand through the first half of this year.
Still, for one day the bullish production news drove traders to quickly unwind pre-existing bets that profit when the market falls. Such trades are closed out by buying futures to cover the position, which can feed into a price rally when it is done in large numbers at the same time.
China slides to Short-term support.
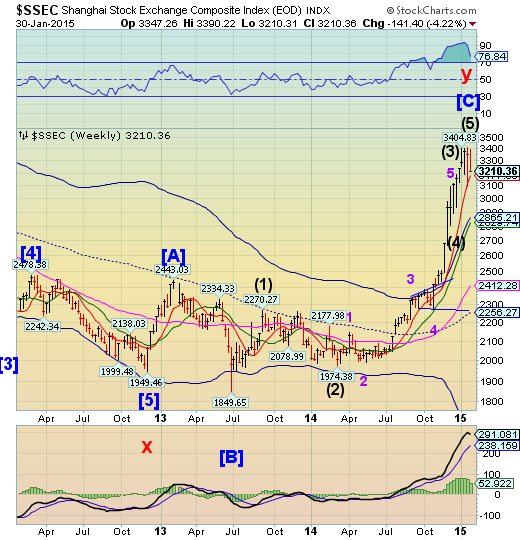
The Shanghai Index slid toward Short-term support at 3177.86 this week, without making a new high. The signal on the Shanghai Index remains neutral until a major support is violated, especially in a parabolic market such as this. If Short-term support is crossed, China may see a significant low in as little as two weeks. Volatility is on the rise in China.
(BusinessTimes) China's stocks fell for a fourth day, capping the biggest weekly decline in a year, amid concern regulatory scrutiny of margin lending and tepid economic growth will curb the benchmark index's world-beating rally.
China Life Insurance (HK:2628) and China Pacific Insurance (HK:2601) slid at least 5 per cent after Great Wisdom said regulators will check insurers' margin trading businesses. Leshi Internet Information & Technology Co dropped 4.8 per cent, paring this month's rally to 49 per cent. Csr Corp (SS:601766) and China CNR Corp Ltd (HK:6199) both lost 7.9 per cent after Huatai Securities Co said it would stop lending shares of the train makers for short-selling.
The Banking Index closed at the bottom of its 3-week trading range.
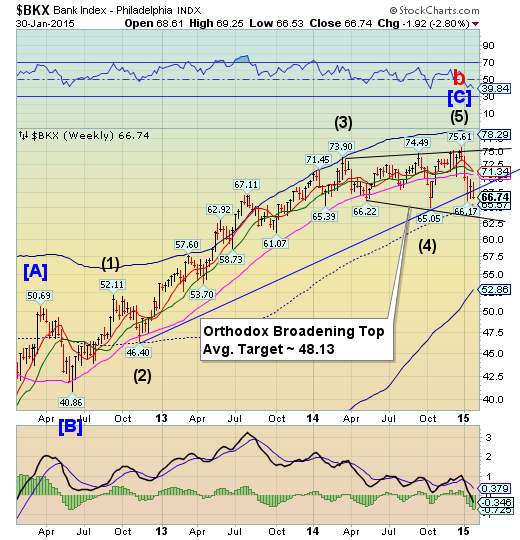
--BKX has re-crossed its Ending Diagonal trendline, staying above weekly mid-Cycle support at 65.57, as it makes ready for the next phase of its decline.It now must decline at least 3-5% beneath the lower trendline of its Orthodox Broadening Top at 62.75 to complete point 6 of the formation. The Cycles Model now implies that a significant low may be due by mid-February that may fulfil those requirements.
(Reuters) - The price of Greek bank debt hit all-time lows this week, shutting off their access to wholesale funding and increasing their reliance on central bank funding.
Greek lenders that enjoyed something of a renaissance last year, allowing them to raise 2.25bn in the bond market saw prices collapse and yields spike after anti-austerity party Syriza won last Sunday's elections, stocking fears of a potential Greece exit from the eurozone.
A 500m March 2017 bond for Piraeus Bank was quoted just below 22% on Friday, a jump from the 5.125% yield at which it priced in March last year.
(Reuters) - Russian banks are rushing to the rescue of large domestic companies by extending loans in order to save them from the prospect of default on US$100bn of foreign debt due this year. Most corporates are currently locked out of international capital markets due to sanctions and the growing economic crisis.
The move comes after the Kremlin and the Central Bank of Russia pumped trillions of roubles of capital and liquidity into the country's banks to enable them to fill a funding hole left by sanctions.
But the rescue is coming at a cost to the wider economy. Russian banks, already in crisis mode because of deposit outflows and rising bad loans, are reluctant to grow their balance sheets - so are cutting lending to smaller clients in order to fund large corporates.
(ZeroHedge) When the Danish Central Bank cut rates precisely a week ago, going from NIRP to NIRPer, and pushing the deposit rate from -0.2% to -0.35%, the sense of desperation was already in the air: after all this was already the second rate cut by the Denmark's monetary authority in one week, all in the hope of preserving the peg to the DKK to the EUR. That sense of desperation just hit a fever pitch moments ago, when the Dutch central bank just went NIRPest, and cut rates across the board yet again, and made it even more costly to save money in the north European country, where the Deposit rate has just been cut from -0.35% to -0.5%!
