REVIEW
Another choppy week in the US as foreign markets continue to confirm downtrends. For the week the SPX/DOW were -1.10%, the NDX/NAZ were -1.45%, and the DJ World index dropped 0.60%. On the economic front positive reports continue to outpace negatives ones. On the uptick: wholesale/business inventories, retail sales, the PPI, the WLEI and the monetary base, plus both weekly jobless claims and the current account deficit improved. On the downtick: export/import prices, consumer sentiment and the budget deficit worsened. Next week we have the FOMC meeting, housing reports and leading indicators.
LONG TERM: bull market
For the past three and one half weeks this market has been in a choppy downward slope while failing to make a new bull market high. This is the longest stretch, without a new uptrend high, since the Nov12-May13 uptrend began. While the market has pulled back only 5.2% during this period. It still appears to be in correction mode.
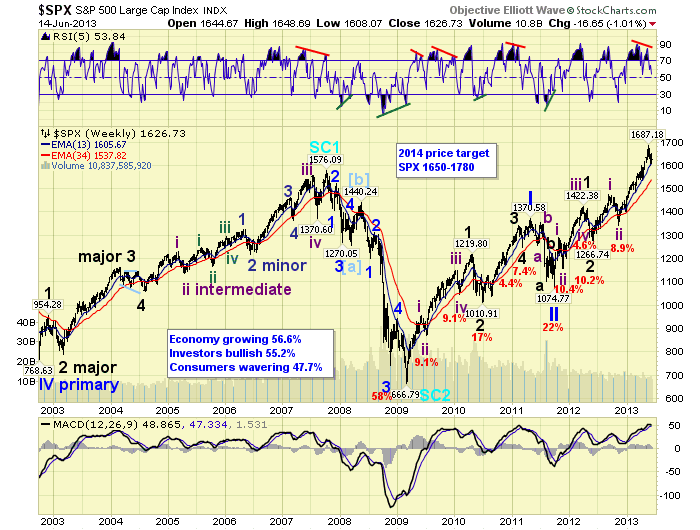
Longer term nothing has changed. We are still counting this four year bull market as Cycle wave [1]. Cycle wave bull markets unfold in five Primary waves. Primary waves I and II completed in 2011, and Primary III has been underway since then. Primary I divided into five Major waves, with a subdividing Major wave 1. Primary III is dividing into five Major waves, but both Major waves 1 and 3 are subdividing into five Intermediate waves. Major waves 1 and 2, of Primary III, ended by mid-2012, and Major wave 3 has been underway since then. Intermediate waves i and ii, of Major 3, ended by late-2012. Intermediate wave iii appears to have ended in May13, and Intermediate wave iv should be currently underway.

After Intermediate wave iv concludes, an uptrending Intermediate v should complete Major 3. Then after a Major 4 correction, an uptrending Major 5 should complete Primary III. Finally, after a Primary IV correction, an uptrending Primary V should complete the bull market. Thus far we continue to project a completion to the bull market by late-winter early-spring of 2014.
MEDIUM TERM: downtrend probable
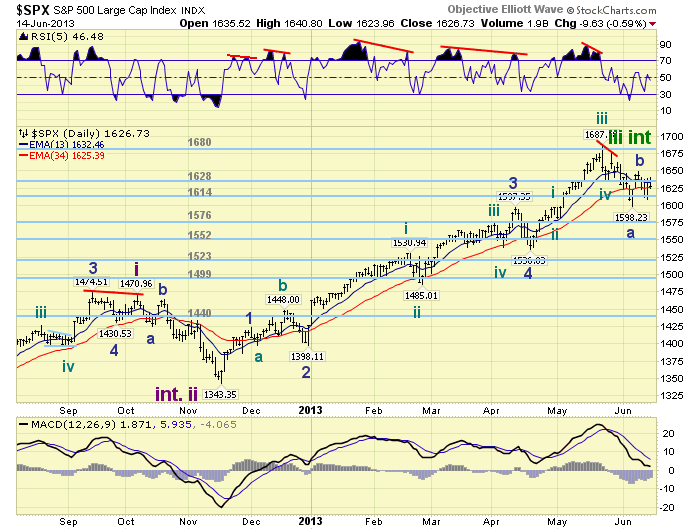
We tracked the six month November-May uptrend, as Intermediate wave iii divided into five Minor waves, with subdivisions in Minor waves 3 and 5. It was a seemingly relentless uptrend, as every potential turning point just created another extension. Nevertheless, it has been more than three weeks since the market has made a new high, while prices have drifted lower.

At this point we can not state with absolute certainty that Intermediate wave iv is underway. Simply because this is not subjective Elliott wave, but objective Elliott wave. OEW quantifies the waves as they unfold. And, OEW has not confirmed the downtrend yet. Nevertheless, we have been counting the SPX 1687/1674 highs as the end of Intermediate wave iii. Intermediate wave iv should unfold in three Minor waves: ABC. We have labeled last weeks low at SPX 1598 as the end of Minor wave A. Then the rally to SPX 1649 as the end of Minor wave B. Minor wave C should currently be underway. Minor A appears to have declined in a double zigzag, and naturally Minor C should do the same.
Our target for Intermediate wave iv remains SPX 1536-1540. This is where several fourth waves concluded during the Int. iii uptrend. Since this small range falls in between two OEW pivots, we expanded Int. iv support to between the 1523 and 1552 pivots. The 1552 pivot also represents a 38.2% retracement of the entire uptrend. So this is probably the most likely support area. Medium term support is at the 1614 and 1576 pivots, with resistance at the 1628 and 1680 pivots.
SHORT TERM
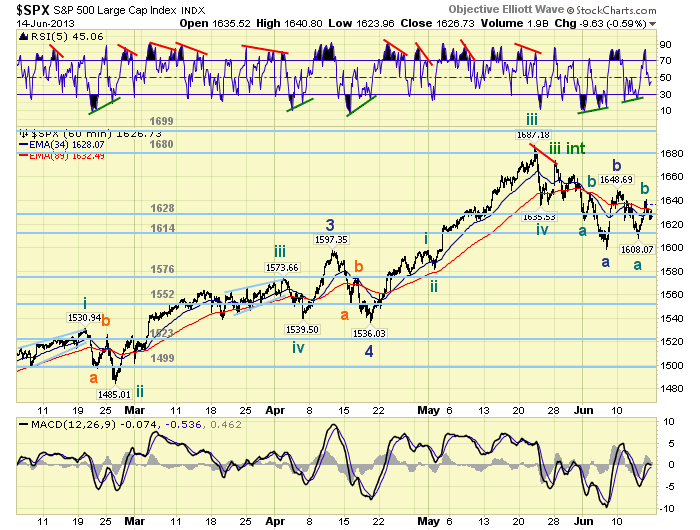
Short term support is at the 1614 pivot and SPX 1593-1598, with resistance at the 1628 pivot and SPX 1636-1640. Short term momentum declined below neutral after hitting quite overbought on Friday. The short term OEW charts are negative with the reversal level now SPX 1630.
This correction has been quite choppy and a bit difficult to decipher. The DOW, for example, has swung triple digits nearly every day as the bulls and bears battle it out. After a complete review of the SPX/DOW charts we feel we have identified the operative pattern.

Minor A unfolded in a double zigzag SPX 1674: 1623-1647-1598. Notice both zigzags were about 50 points. For the DOW, both zigzags were about 400 points. Minor B was a sharp rally from SPX 1598-1649/48 which appeared to have ended in a diagonal triangle. Minor C, thus far has declined in a zigzag from SPX 1649/48-1608, or about 40 points. This was followed by quite a sharp rally to SPX 1641 on Friday. The market should now be embarking on its second zigzag of Minor C.
Another 40 point decline would put the SPX back to 1598, for a double bottom flat. An 80 point decline would put the SPX in the OEW 1552 pivot range. Both patterns could work to end the correction. An alternate count, being carried on the DOW charts, suggests Minor B is still underway and a retest of SPX 1648/49 is next. Early next week should give us the answer to these two counts. Best to your trading!
Another choppy week in the US as foreign markets continue to confirm downtrends. For the week the SPX/DOW were -1.10%, the NDX/NAZ were -1.45%, and the DJ World index dropped 0.60%. On the economic front positive reports continue to outpace negatives ones. On the uptick: wholesale/business inventories, retail sales, the PPI, the WLEI and the monetary base, plus both weekly jobless claims and the current account deficit improved. On the downtick: export/import prices, consumer sentiment and the budget deficit worsened. Next week we have the FOMC meeting, housing reports and leading indicators.
LONG TERM: bull market
For the past three and one half weeks this market has been in a choppy downward slope while failing to make a new bull market high. This is the longest stretch, without a new uptrend high, since the Nov12-May13 uptrend began. While the market has pulled back only 5.2% during this period. It still appears to be in correction mode.
Longer term nothing has changed. We are still counting this four year bull market as Cycle wave [1]. Cycle wave bull markets unfold in five Primary waves. Primary waves I and II completed in 2011, and Primary III has been underway since then. Primary I divided into five Major waves, with a subdividing Major wave 1. Primary III is dividing into five Major waves, but both Major waves 1 and 3 are subdividing into five Intermediate waves. Major waves 1 and 2, of Primary III, ended by mid-2012, and Major wave 3 has been underway since then. Intermediate waves i and ii, of Major 3, ended by late-2012. Intermediate wave iii appears to have ended in May13, and Intermediate wave iv should be currently underway.

After Intermediate wave iv concludes, an uptrending Intermediate v should complete Major 3. Then after a Major 4 correction, an uptrending Major 5 should complete Primary III. Finally, after a Primary IV correction, an uptrending Primary V should complete the bull market. Thus far we continue to project a completion to the bull market by late-winter early-spring of 2014.
MEDIUM TERM: downtrend probable
We tracked the six month November-May uptrend, as Intermediate wave iii divided into five Minor waves, with subdivisions in Minor waves 3 and 5. It was a seemingly relentless uptrend, as every potential turning point just created another extension. Nevertheless, it has been more than three weeks since the market has made a new high, while prices have drifted lower.

At this point we can not state with absolute certainty that Intermediate wave iv is underway. Simply because this is not subjective Elliott wave, but objective Elliott wave. OEW quantifies the waves as they unfold. And, OEW has not confirmed the downtrend yet. Nevertheless, we have been counting the SPX 1687/1674 highs as the end of Intermediate wave iii. Intermediate wave iv should unfold in three Minor waves: ABC. We have labeled last weeks low at SPX 1598 as the end of Minor wave A. Then the rally to SPX 1649 as the end of Minor wave B. Minor wave C should currently be underway. Minor A appears to have declined in a double zigzag, and naturally Minor C should do the same.
Our target for Intermediate wave iv remains SPX 1536-1540. This is where several fourth waves concluded during the Int. iii uptrend. Since this small range falls in between two OEW pivots, we expanded Int. iv support to between the 1523 and 1552 pivots. The 1552 pivot also represents a 38.2% retracement of the entire uptrend. So this is probably the most likely support area. Medium term support is at the 1614 and 1576 pivots, with resistance at the 1628 and 1680 pivots.
SHORT TERM
Short term support is at the 1614 pivot and SPX 1593-1598, with resistance at the 1628 pivot and SPX 1636-1640. Short term momentum declined below neutral after hitting quite overbought on Friday. The short term OEW charts are negative with the reversal level now SPX 1630.
This correction has been quite choppy and a bit difficult to decipher. The DOW, for example, has swung triple digits nearly every day as the bulls and bears battle it out. After a complete review of the SPX/DOW charts we feel we have identified the operative pattern.

Minor A unfolded in a double zigzag SPX 1674: 1623-1647-1598. Notice both zigzags were about 50 points. For the DOW, both zigzags were about 400 points. Minor B was a sharp rally from SPX 1598-1649/48 which appeared to have ended in a diagonal triangle. Minor C, thus far has declined in a zigzag from SPX 1649/48-1608, or about 40 points. This was followed by quite a sharp rally to SPX 1641 on Friday. The market should now be embarking on its second zigzag of Minor C.
Another 40 point decline would put the SPX back to 1598, for a double bottom flat. An 80 point decline would put the SPX in the OEW 1552 pivot range. Both patterns could work to end the correction. An alternate count, being carried on the DOW charts, suggests Minor B is still underway and a retest of SPX 1648/49 is next. Early next week should give us the answer to these two counts. Best to your trading!