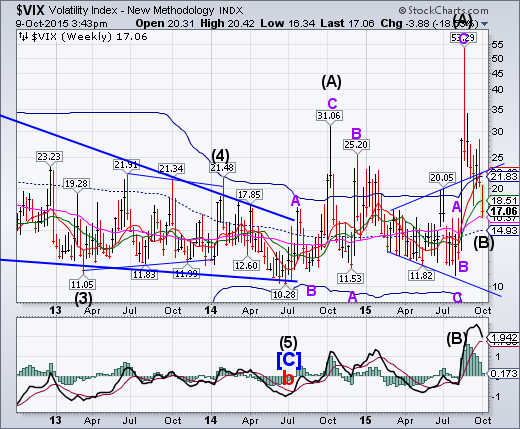
VIX challenged its Long-term support at 16.37 but closed above it. Usually a drop under 20 is a harbinger of calmer markets. ZeroHedge says, “Not so fast!” Selling Volatility is not a safe bet, says Bloomberg.
The SPX right shoulder now matches the left.
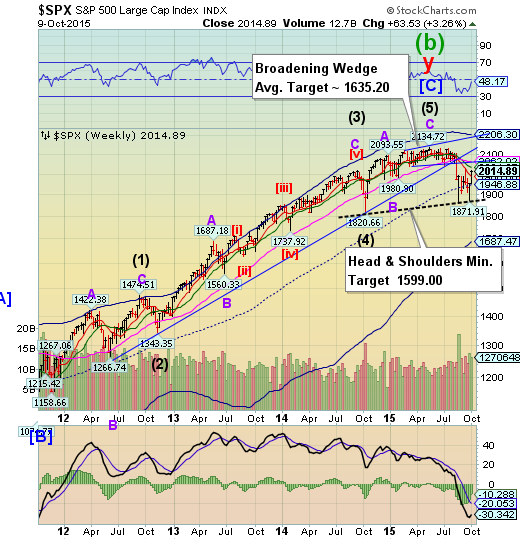
The right shoulder of the Head & Shoulders formation in the SPX now matches the left shoulder at 2019.26 on September 19, 2014. Today’s high was 2020.13. It was unable to rise above weekly Intermediate-term resistance at 2031.87 and is now vulnerable to a decline. The Cycles Model calls for a potential decline for the next 2 weeks.
(Reuters) - Wall Street was little changed in choppy trading on Friday, as investor optimism due to fading chances of an interest rate hike this year was offset by a fall in energy and financial stocks.
Minutes from the Federal Reserve's September meeting showed policymakers were worried about a global economic slowdown weighing on the economy, which investors took to mean that rates would stay at near-zero levels this year.
"The fact that we had a correction in August gives the market some room to move," said Randy Frederick, managing director of trading and derivatives for Charles Schwab (NYSE:SCHW) in Austin, Texas.
NDX may have completed a right shoulder.
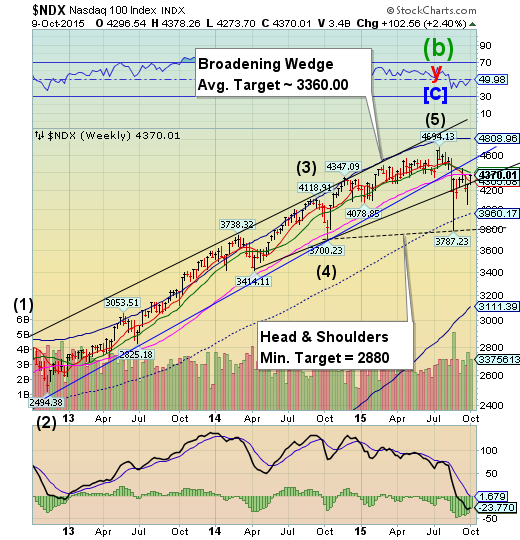
NDX stalled at weekly Long-term resistance at 4385.24. The right shoulder of a Head and Shoulders formation appears to be complete, or nearly so. A decline beneath the trendline at 4300.00 may trigger the Broadening Wedge formation. The next support after that is the August low.
(ZeroHedge) The week summarised... as BofA put it -"It's Not A Risk-On Rally, This Is The Biggest Short Squeeze In Years"
With China shut and The Fed going full dovish panic-mode over growth fears, world markets went crazy...
(ZeroHedge) Back in March, just before the last parabolic phase of the biotech bubble, we showed something which at the time we thought was quite amazing: of the 150 companies that made up the Nasdaq Biotech Index, only 41 had any earnings. Of these 41 companies, just five companies (Gilead (NASDAQ:GILD), Amgen (NASDAQ:AMGN), Shire (NASDAQ:SHPG), Biogen (NASDAQ:BIIB) and Celgene (NASDAQ:CELG)) had earnings of at least $1 billion each, and the five combined accounted for 83% of all earnings in the entire sector. The combined Net Income of the profitable companies was $21 billion; this compared to a market cap for the NBI of $1.1 trillion, a 50x P/E ratio.
High Yield Bonds retest mid-Cycle resistance.
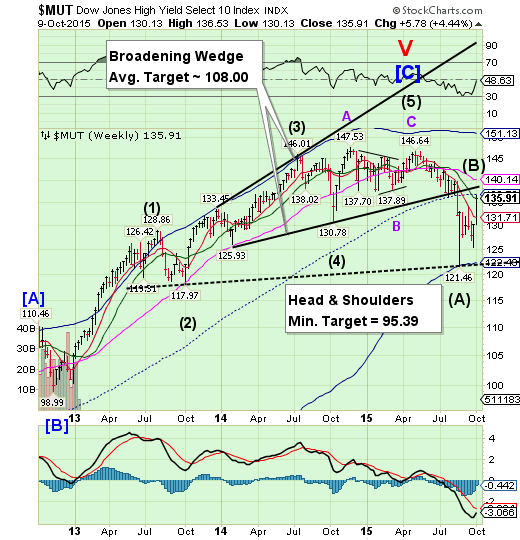
The High Yield Index retested mid-Cycle resistance at 136.78, closing beneath it. This does not change the bearish view for High Yield bonds. The Cycle Bottom/Head and Shoulders neckline may be challenged again. The Cycles Model suggests a substantial decline in HY over the next two weeks.
(NWITimes) Legendary investor Carl Icahn released a short video on his website, www.carlicahn.com, and I think it merits watching.
Much of the video is kind of a list of grievances that we all have. The federal government is a disaster, the tax code is a mess, and the stewards of our great American corporations are managing with short-term myopic thinking. All of this is true of course, but not all that insightful. I think we all have a gut feeling something is deeply wrong with American centers of power; Mr. Icahn is simply expressing, in a nice articulate fashion (and New York accent), the voice of all of us.
But part of the video also includes a warning for investors, and the warning involves something I’ve been watching for a quite a while as well: the high-yield bond market.
The euro breaks through Long-term resistance.
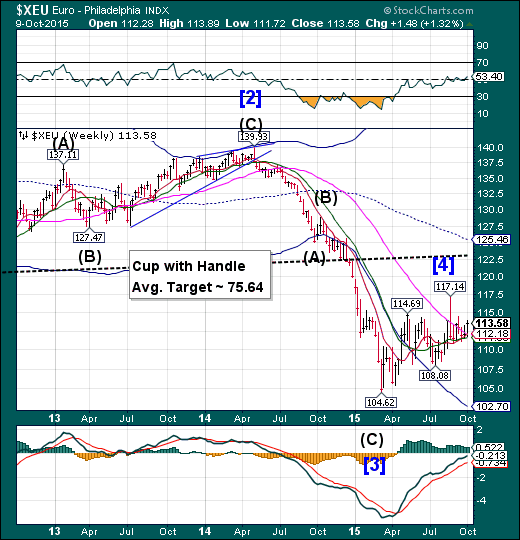
The euro broke above Long-term resistance at 112.18, but is due for a sharp decline that may last up to 2 weeks. It is probable that the euro trend toward parity with the USD may be resuming shortly, as the next technical support lies at 102.70.
(Bloomberg) Credit Suisse Group AG (SIX:CSGN) is running a “small position” to profit from a drop in the euro against the dollar as it reduces investments that are vulnerable to sudden shifts in currency levels, said Robert Parker, a senior adviser in the investment, strategy and research group.
Switzerland’s second-largest bank is avoiding major bets in the foreign-exchange market because volatility among major currencies has been low, Parker said in an interview by phone from London. The euro has been trading in a range of $1.08 to $1.17 since the middle of May, after recovering from a 12-year low of $1.0458 reached on March 16. In 2014, the common currency had swung between $1.3993 and $1.2097.
EuroStoxx challenges the Lip of a Cup with Handle formation.
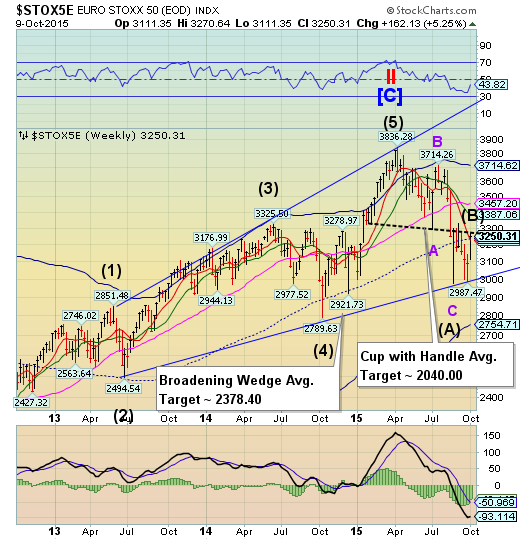
EuroStoxx 50 bounced at its Broadening Wedge trendline to the Lip of a very bearish Cup with Handle formation. The Cycles Model suggests a potential decline lasting two weeks or more. A reversal here may cause a panic decline that may challenge the 2011-2012 lows.
(MarketWatch) European stock markets finished firmly higher on Friday, a day after minutes from the Federal Reserve’s September policy meeting confirmed the U.S. central bank’s reluctance to lift interest rates amid slowing global growth and stubbornly low inflation.
The prospect of lower interest rates has been a boon to riskier assets like stocks, lifting their appeal to investors.
The optimism in European stock markets follows last Fridays surprisingly weak U.S. labor market, which fueled expectations the Fed won’t start to tighten monetary policy this year. Minutes from the central bank’s Sept. 17 meeting — held before the lackluster jobs report — supported that notion.
The yen continues a tight, sideways consolidation.
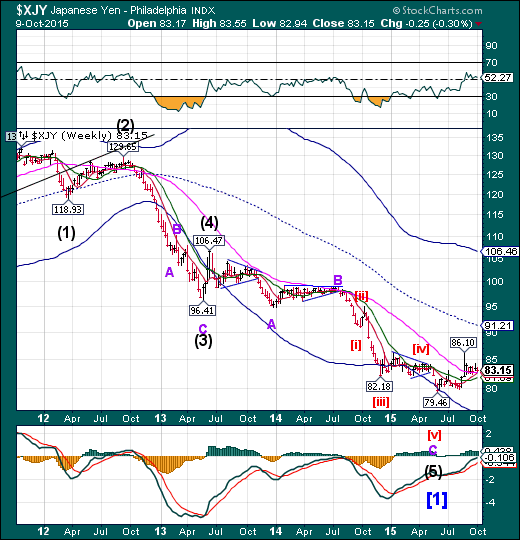
The yen continued to consolidate in a tight range last week. It may emerge to challenge its weekly Cycle Top at 106.70 between mid-October and early November. Another breakout above 86.10 may confirm the actionable signals, as a rally in the yen is evidence of an unwinding of the yen carry trade that may be underway due to falling equities.
The Nikkei rallied to Short-term resistance.
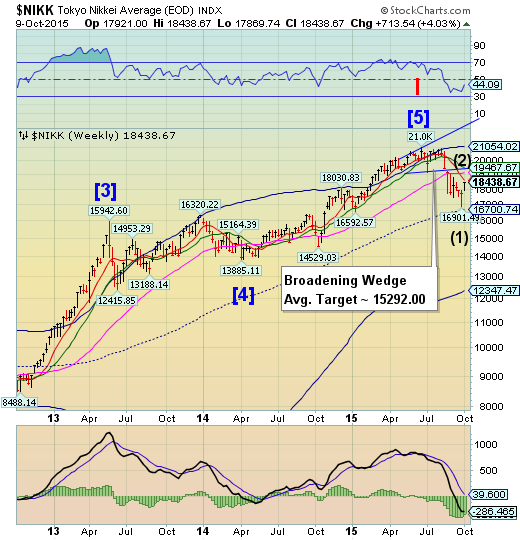
The Nikkei rallied toward Short-term resistance at 18584.73, stalling beneath that level. A Trading cycle low appears to be due in two weeks. Should the decline go beneath mid-cycle support at 15700.74, the Nikkei may go into free-fall.
(MotleyFool) Japanese investors finished a good week on Friday, as the Nikkei 225 rose almost 300 points to close at 18,439. For the week, Friday's move brought the total gain for the Nikkei to more than 700 points, or almost 4%, and many market commentators credited the day's advance to the release of meeting minutes from the Federal Reserve's most recent monetary policy meeting. Yet even though the U.S. central bank contributed to a positive mood in financial markets around the world, some market-specific factors also helped push Japanese stocks higher and could reveal some hints about the likely future course for the Nikkei in the longer run.
U.S. Dollar loses Long-term support.
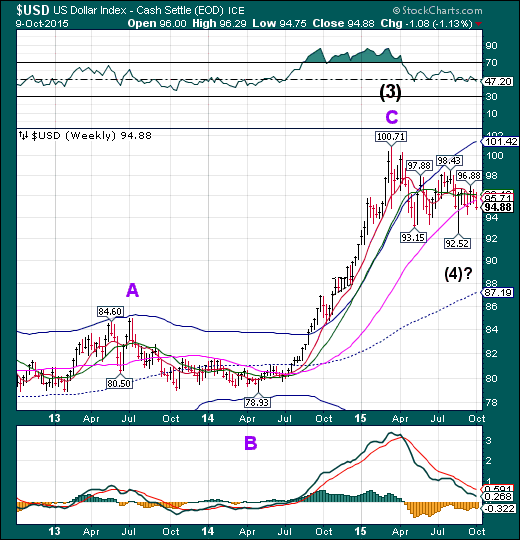
The US dollar declined through weekly Long-term support at 95.64, allowing it to seek a lower level. It may challenge its last low at 92.52 over the next week or two as confidence in the stability of the dollar is challenged.
(Reuters) Speculators pared back bullish bets on the U.S. dollar in the latest week, according to Reuters calculations and data from the Commodity Futures Trading Commission released on Friday.
The value of the dollar's net long position slipped to $20.89 billion in the week ended Oct. 26, from $21.73 billion the week before. This was the third time in four weeks U.S. dollar longs came in under $21 billion. The speculative community has been long the dollar since May last year.
To be long a currency is to make a bet it will rise, while being short is a bet its value will decline.
USB corrects beneath Short-term support/resistance.
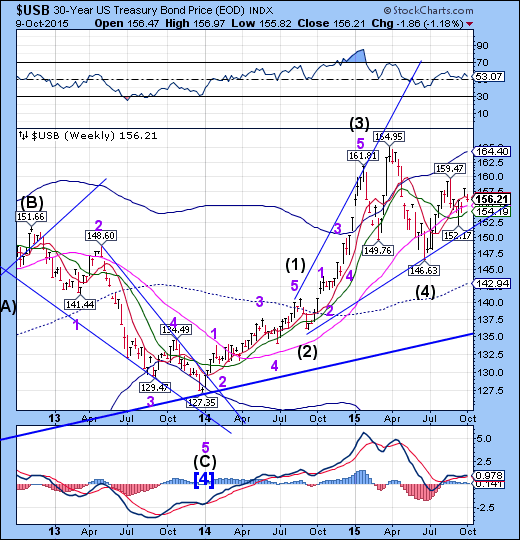
The Long Bond appears to have completed a corrective phase of its upward trend. However, it may test lower supports now that it has declined beneath Short-term support/resistance at 156.69. A drop to lower levels may put the uptrend in jeopardy, but should it emerge above resistance, we may see the rally resume towards its Cycle Top at 164.40.
(Bloomberg) Steven Major is counting on the Federal Reserve to help him repeat history.
The London-based head of fixed-income research at HSBC Holdings Plc (LONDON:HSBA), who stood out in 2014 by correctly predicting that 10-year Treasury yields would fall, cut his end-of-2016 yield forecast to just 1.5 percent, from 2.8 percent previously. That once again puts him at odds with the consensus, with the median of 60 economist predictions compiled by Bloomberg giving a reading of 3 percent.
Gold is at a make-or-break point.
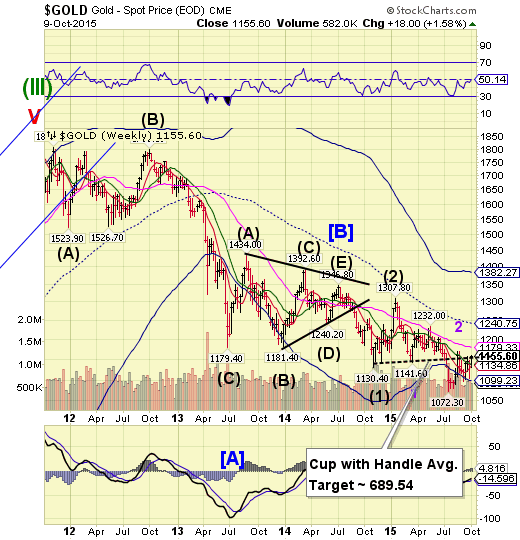
Gold is again challenging trendline overhead resistance in an attempt to change its trend. The Cycles Model suggests that if gold can make its Long-term resistance at 1179.33 in the next week, it may succeed, at least for a while. However, a failure may bring on new lows beneath 1072.30.
(WSJ) Gold prices rallied to their highest level in seven weeks on Friday amid optimism that the Federal Reserve would put off raising interest rates till 2016.
The most actively-traded contract, for December delivery, rose $11.60, or 1%, to settle at $1,155.90 a troy ounce on the Comex division of the New York Mercantile Exchange. This was the highest close since Aug. 21, when gold settled at $1,159.60 an ounce.
Investors marched back into the gold market after minutes from the Federal Reserve’s September meeting showed officials were concerned about low inflation and economic problems in China. While Fed officials held off on raising rates at the meeting, their cautious tone reflected in the minutes fanned investors’ hopes that the U.S. central bank would stand pat on monetary policy for the remainder of the year.
Crude’s false break may be over.
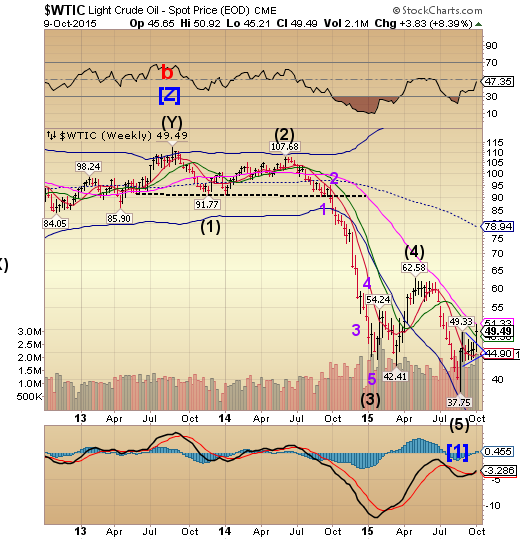
Crude made its false break to challenge its weekly Long-term resistance at 51.33. It fell short. The Cycles Model suggests an overdue Master Cycle low may arrive over the next two weeks. The issue seems to be the lack of support beneath its August low at 37.75. A breach of that level would have serious consequences.
(WaPo) The House voted 261 to 159 on Friday to lift restrictions on crude-oil exports, capping a year of heavy lobbying by the American Petroleum Institute, many of the nation's biggest petroleum companies and leading shale oil producers.
But the measure still faces a Senate that doesn't appear eager to take up the issue and a White House that has flatly pledged to veto it. The Office of Management and Budget on Wednesday said that the administration is "strongly opposed" to the legislation, which it said is "not needed at this time." Some industry executives privately concede that it is unlikely to become law before the next presidential administration
Shanghai Index is back from holiday.
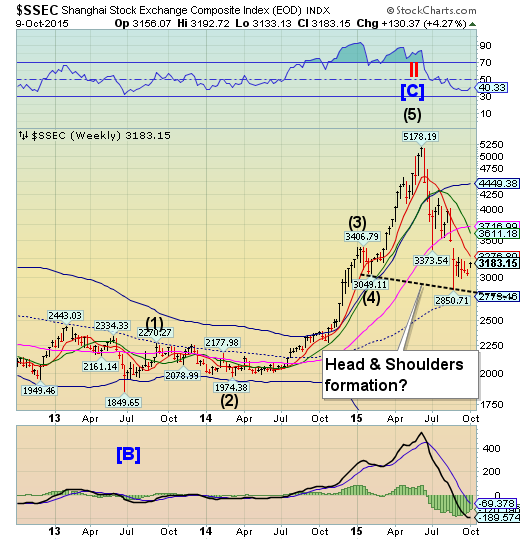
The Shanghai Index is back at work from a week-long holiday respite. The initial session (Thursday) was weak, but picked up steam on Friday. However, there may be a new Head and Shoulders formation suggesting a target beneath 2000.00 and Short-term resistance is at 3276.89, which may aid in forming the right shoulder of that formation. Next two weeks may be very critical, according to the Cycles Model.
(ZeroHedge) Despite the disappointingly weak China re-open (notably less than US ADRs had implied), it appears everyone and their pet rabbit levered up as China margin-buying rose CNY21bn - the most in 2 months. It appears China's housing market also disappointed hope-strewn expectations as Golden Week home sales slowed dramatically YoY (blamed on weather). All is not well in the liquidity stress department, as despite ongoing injections, o/n HIBOR spiked 240bps overnight. China stocks are mixed at the open as PBOC strengthens the yuan fix for the 5th day in a row to 2 month highs. Concerns are also growing in China's corporate bond market, where bubble flows have greatly rotated from stocks to drive yields on risky firms to record lows.
The China (Stock) Bubble Is Dead, Long Live The China (Bond) Bubble...
The Banking Index closes at mid-Cycle support.
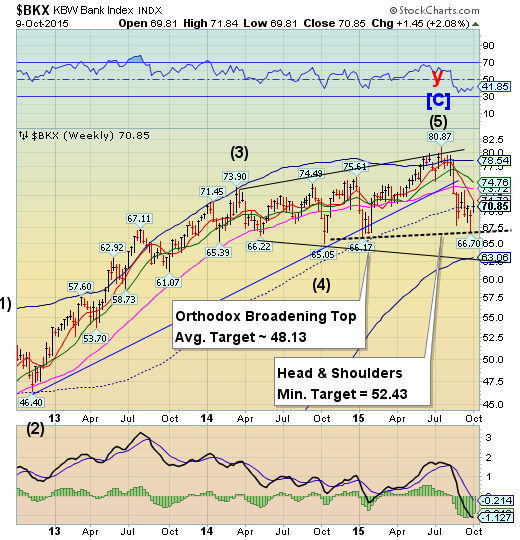
BKX enjoyed a burst of strength early in the week, but was repelled by Short-term resistance at 71.73, closing on its mid-Cycle support at 70.80. A resumption of weakness may lead to a retest of the lows next week. There is a potential new Head and Shoulders formation with a similar target as the Broadening Top.
(ZeroHedge) Amid numerous rumors that Deutsche Bank (XETRA:DBKGn) is among the corporations exposed to the VW fiasco, and to be clear there is no news to confirm that, DB has just kitchen-sinked it in a pre-announcement:
*DEUTSCHE BANK SEES 3Q NET LOSS EUR 6.2 BLN
*DEUTSCHE BANK TO RECOMMEND DIVIDEND CUT OR POSSIBLE ELIMINATION
Deutsche Bank stock is crashing down around 6% after-hours on the news
(ZeroHedge) Not everything is "fine" in the land of European banks; in fact, quite the opposite.
One day after Deutsche Bank warned of a massive $7 billion loss and the potential elimination of the bank's dividend, which had been a German staple since reunification, a move which many said was a "kitchen sinking" of the bank's problems (but not Goldman (NYSE:GS), which said it was "not a kitchen sinking, but a sign of the magnitude of the challenge" adding that "this development confirms our view that the task facing new management is very demanding. Litigation issues do not end with this mark down – we expect them to persist for a multi-year period. We do not see this as a "clean up" but rather an indication of what the "fixing" of Deutsche Bank will entail over the 2015-18 period), it was the turn of Switzerland's second biggest bank after UBS (NASDAQ:UBSI), Credit Suisse (NYSE:CS), to admit it too needs more cash when moments ago the FT reported that the bank is "preparing to launch a substantial capital raising" when the new CEO Thiam unveils his strategic plan for the bank in two weeks’ time.
FT adds that "while not specifying an amount, they pointed to a poll published last week by analysts at Goldman Sachs concluding that 91 per cent of investors expect the Swiss bank to raise more than SFr5bn in new equity."
(ZeroHedge) Things in Brazil are getting worse by the day as the following brief summary of soaring interest rates courtesy of BNAmerics demonstrates.
Brazil Bank Interest Rates At 20-Year High
Brazil's overdraft interest rates reached 12.28% in October, the highest since September 1995 when the rate was 12.58%, according to research conducted by consumer protection group Procon.
Of the seven financial institutions included in the research, five increased their overdraft rates and one upped its rate for personal loans. The average overdraft rate of 12.28% per month was higher than that registered in September, 11.90%.
(Reuters) The financial sector, recently a weak performer in the stock market, will garner the majority of investor attention next week as a number of big banks post their quarterly results.
Goldman Sachs Group, Bank of America Corp (NYSE:BAC), Wells Fargo & Co (NYSE:WFC), Citigroup (NYSE:C) and JPMorgan Chase & Co (NYSE:JPM) - the five biggest U.S. banks by market cap - are due to report results as the sector has trailed the market in recent weeks and earnings estimates have fallen.
Financial companies are expected to show earnings growth of 8.4 percent, behind only telecoms and consumer discretionary companies in expected growth for the quarter. However, that growth is down from the 14.8 percent expected at the start of the quarter, and down by half from the 17.8 percent growth expected at the start of the year.
