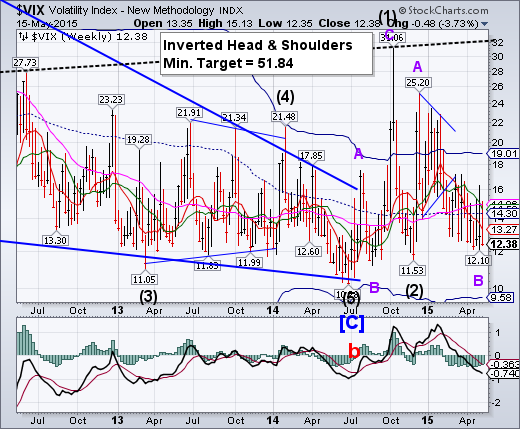
-- Volatility made a new Cycle low on Monday, May 4,then proceeded to run through all the resistance levels before closing near the low of its reversal pattern. A close above the May 6 high may confirm a sell signal for SPX.
S&P 500 trendless market (top) may be ending.
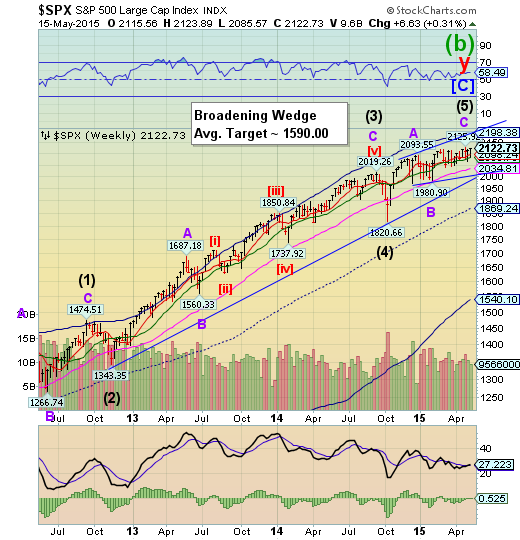
SPX closed the week on a high note, but did not exceed its April 27 high..The May 6 low qualifies as a Master Cycle low.A failure to make a new high here may have made the Cycle extremely left-translated and bearish. A loss of support on Monday may signal a panic decline through the end of June..
(ZeroHedge) We don’t talk too often (because we don’t use them) about traditional technical analysis indicators. We have nothing against them; it’s just that we have our own methodologies and processes that work for us.One indicator we do like to keep an eye on is the ADX, or Average Directional Index. It is essentially an indicator of the strength (or lack of strength) of the prevailing trend over a specified period, regardless of the trend’s direction. A high number indicates a strongly trending market and a low number reflects a lack of trend. The traditional default look-back period is 14 days so we tend to stick with that. Interestingly, recent readings of the 14-day ADX applied to the S&P 500 have been among the lowest of the last 65 years, indicating an extremely “trendless” market.
Nasdaq 100 makes a reversal pattern.
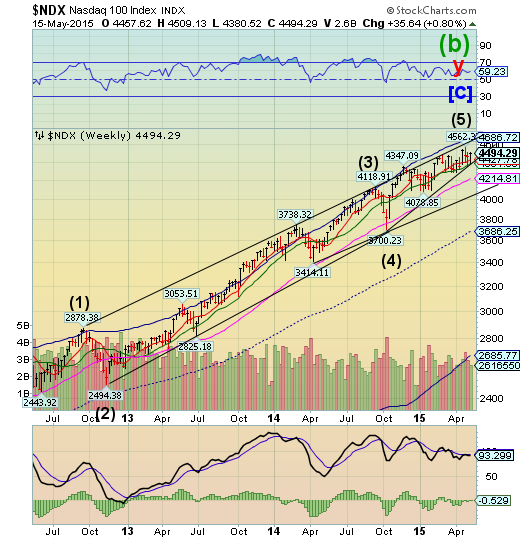
NDX made its final high on April 27, ending a five wave rally. Since then it has made an impulse down and a significant, but not a complete retracement. This is important, since the declining impulse was a Master Cycle low on May 6. Its Ending Diagonal trendline is at 4425.00. Breaking the trendline implies a complete retracement to its October 15 low at 3700.23.
(MarketWatch) U.S. stocks ended the day’s choppy session marginally higher Friday with the main indexes eking out weekly gains.
Investors grappled with weaker-than-expected economic reports which left the timing of the Federal Reserve’s next rate hike still uncertain for investors.
A pair of manufacturing data released ahead of the market open, came in below expectations, underlying the recent trend of weakness poking through in the U.S. economy. The preliminary May reading on consumer sentiment fell to the lowest level in seven month, also well below forecasts.
High Yield Bonds could not make a new high.
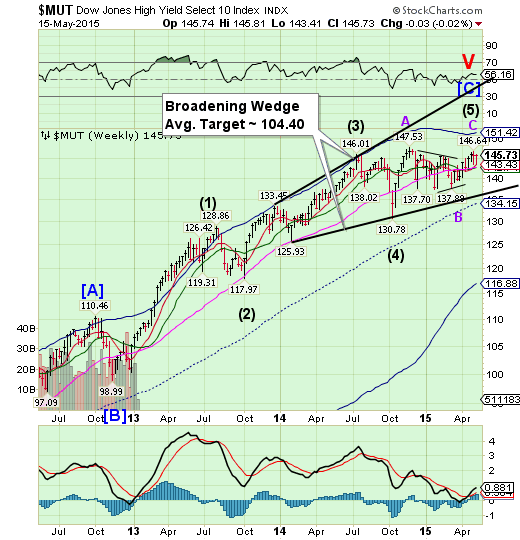
Try as it might, the High Yield Index has not been able to better its November 28 high at 147.53.The best fit Elliott Wave formation is an A-B-C, with Wave C falling short of the top of Wave A. That consolidation in the middle turns out to be a Triangle Wave B, which calls for a final probe to a new high, but no luck so far.It now appears that the final high was a truncation, meaning it did not achieve its normal target. It also made a low on May 6.A failure at this point may cause difficulties in new high yield financing that has supported stock prices during a declining macroeconomic environment. This may not end well.
(MarketWatch) Two of the first three episodes of the newly reprised “Wall Street Week” television show have featured famous investors sounding alarms on high yield or “junk” bonds.
In the kickoff episode, mutual-fund manager Jeffrey Gundlach of DoubleLine Capital noticed that high-yield bonds had never gone through an extended rising rate environment. At their current high prices and low starting yields, high-yield bonds might be more rate-sensitive than investors think
The Euro extends its rally.
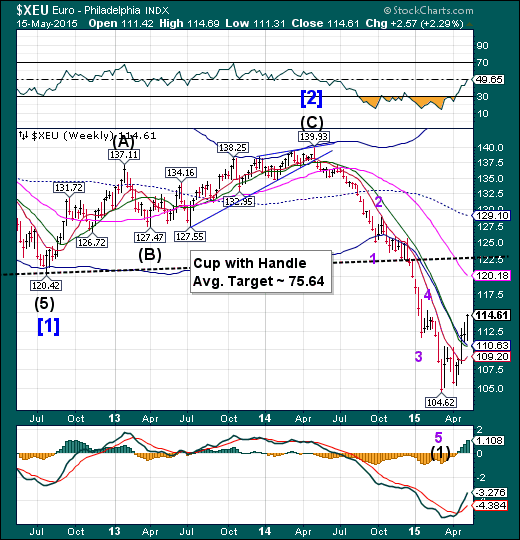
The Euro rally extended another week to make an inverted Trading cycle high.It has remained short of its target of 115.34. The Model now forecasts a probable five weeks of weakness, and possibly a panic decline in the Euro.
(MarketWatch) The dollar depreciated against the euro for a fifth straight week on Friday, as weak U.S. economic data prompted traders to push back their expectations for when the Federal Reserve will raise interest rates.
A preliminary reading of consumer sentiment in May by the University of Michigan came in at 88.6, down from 95.9 in April — a seven-year low. That, combined with a disappointing result for the May Empire State manufacturing index and the Federal Reserve’s April reading on industrial-production activity pushed the dollar 0.3% lower against the euro Friday. The data showed that the second-quarter rebound that many economists, including Federal Reserve policy makers, had hoped for has yet to fully materialize.
Euro Stoxx 50 weakens further.
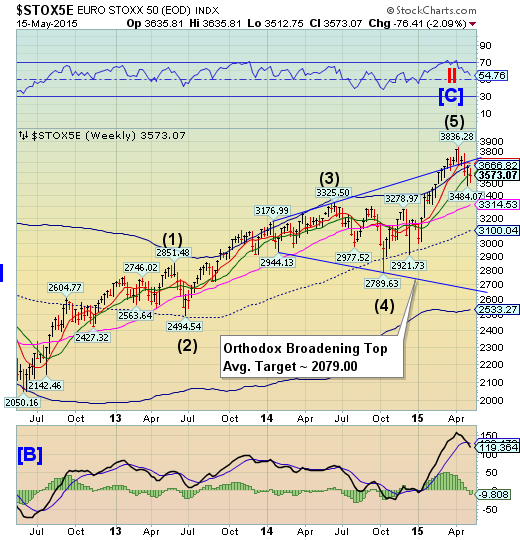
EuroStoxx 50 weakened further, closing beneath Intermediate-term support/resistance at 3594.49. It is now on a sell signal within the Orthodox Broadening Top formation. This may be considered a reversal in trend that may receive further confirmation by declining beneath its Long-term support at 3314.53. The Cycles Model suggests a potential panic decline beginning the third week of May to kick off the new trend.
(WSJ) The euro surged to its highest level against the dollar since February on Friday, dragging down European stock markets.
Having fallen early in the session, the common currency rallied in the afternoon following some disappointing U.S. industrial production data. It rose 0.3% on the day to $1.1431.
The move extends a rebound from a 12-year low of less than $1.05 in mid-March.
The Yen sideways consolidation may be another Triangle.
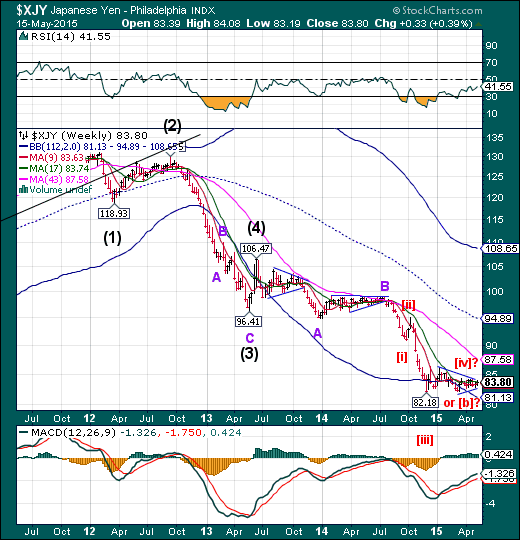
The Yen continues its sideways consolidation, unable to break either up or down. All indications point to a probable strong breakout, but will it be up or down?The Cycles Model suggests a probable period of weakness for the next three weeks or longer, suggesting the sideways consolidation may have been a probable Wave [iv] Triangle. A downside break may confirm that view.
The Nikkei 225 is still beneath its April 23 high.
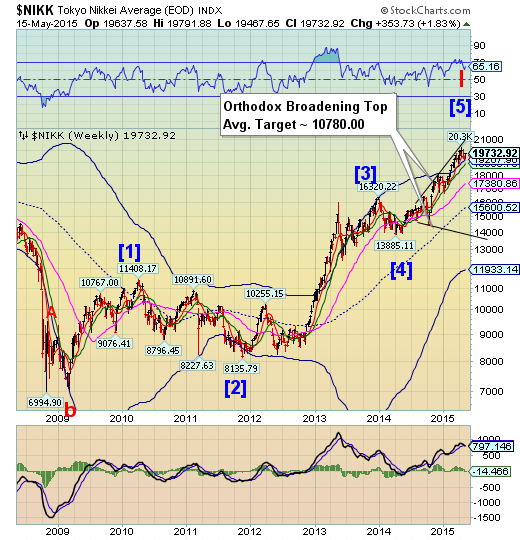
The Nikkei continues to consolidate beneath its April 23 high at 20252.12. A period of weakness is taking hold, which may kick off a six week decline.The reversal may be confirmed with the loss of weekly Short-term and Intermediate-term supports.
(Bloomberg) Convention dictates investors become more uneasy as the structure of their investments gets more complex. In Japan, the opposite may now be the case.
April sales of so-called uridashi bonds tied to two or more equities were the second highest on record for any month according to data compiled by Bloomberg going back to 1997. Most of the securities -- investments targeted at Japanese households -- are linked to the Nikkei 225 Stock Average and another gauge such as the Standard & Poor’s 500 Index.
The Nikkei’s climb above 20,000 for the first time in 15 years last month and the S&P 500’s ascent to a record have increased investor concern the market is overheated and may reverse course. According to Credit Suisse, the Nikkei gains have seen more people put their money into contracts that start losing money when at least one of the multiple gauges they’re tied to drops below preset levels. Those levels are generally lower than for notes tied to single indexes.
US Dollar Index approaching a Cycle low.
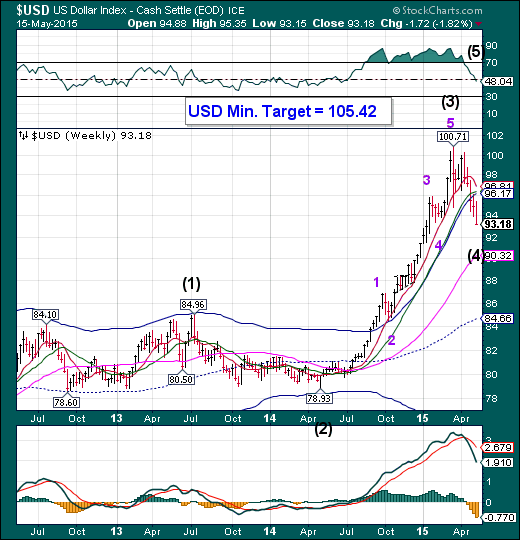
The US Dollar may be facing a combination Primary and Master Cycle low early next week.A final blow-off top may ensue, with a minimum target of 105.42. The first leg of the rally may last through the end of June, but may revive again later in July, after an expected Trading Cycle low
(Reuters) Speculators further pared back positive bets on the U.S. dollar in the latest period,pushing the currency's net long position to the lowest in nine months,according to Reuters calculations and data from the Commodity Futures Trading Commission released on Friday.
The value of the dollar's net long position fell to $29.11 billion in the week ended May 12, from $32.25 billion the previous week. Net longs on the dollar declined for a seventh straight week. It was also the fifth straight week that longs on the dollar came in below $40 billion. The dollar has been weakened by a slew of soft U.S. economic data.
U.S. 30-Year bounces, but the decline isn’t complete.
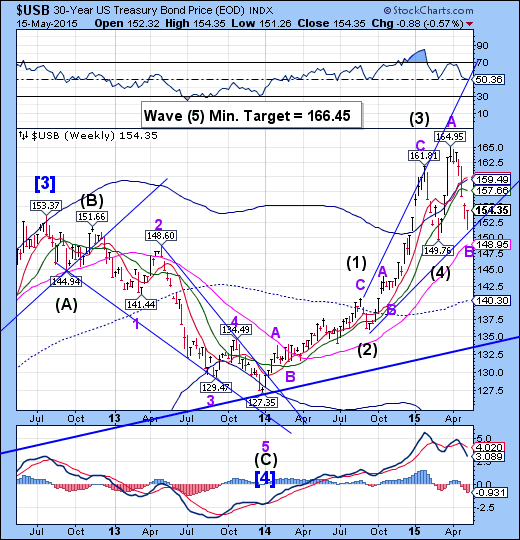
The Long Bond bounced from a significant low at 151.26 on May 13, which may qualify as a Master Cycle low.There may be a period of strength that may propel USB higher through the end of June. The minimum target for this rally appears to be 166.45. USB may go higher in this Broadening Wedge formation.
(WSJ) The U.S. Treasury market roared back Friday as economic data raised worries about U.S. growth, helping safer bonds recover from a month of heavy selling.
Government bond prices rounded out the day at session highs, helping the U.S. 10-Year yield post its biggest one-day decline since March 18 and its first weekly pullback in a month. Bond yields decline when prices rise.
For the session, benchmark 10-year notes gained 27/32 in price to yield 2.141%. The 30-year bond rose 1 8/32 to yield 2.937%.
Gold extends its retracement to the 50% level.
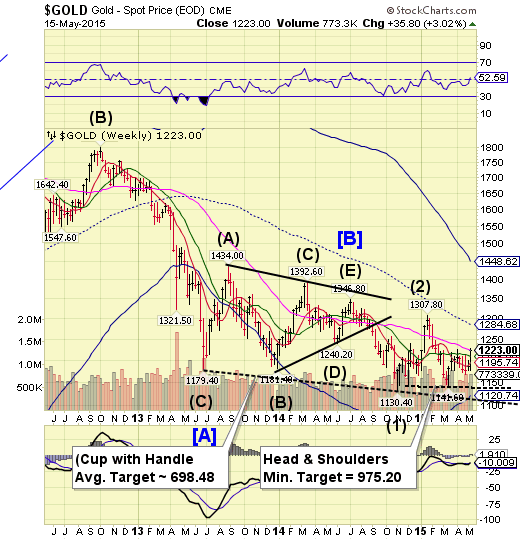
Gold extended its retracement to the 50% level, closing at Long-term resistance. A decline beneath 1141.60 triggers the Head & Shoulders formation with a minimum target of 975.20.The Cycles Model suggests gold made a Trading Cycle inversion (60 days from its March 17 low) this week which calls for a substantial low in late June. Cycle inversions may occur when circumstances dictate that larger amounts of liquidity than usual appear in the markets. Options expiration has been one of those periods, as of late.
(WSJ) Gold prices extended their rally to a three-month high on Thursday, as lower producer-price data fueled hopes the Federal Reserve will put off raising U.S. interest rates.
The most actively traded contract, for June delivery, rose $7, or 0.6%, to settle at $1,225.20 a troy ounce on the Comex division of the New York Mercantile Exchange. That was the highest close since Feb. 13, when prices ended at $1,227.10 an ounce.
The U.S. producer-price index, a measure of prices businesses receive for their goods and services, fell 0.4% in April from March. Core prices, which exclude food and energy, fell 0.2%. Economists surveyed by The Wall Street Journal had expected both overall and core prices to climb 0.1%.
Crude may be reversing from its retracement high.
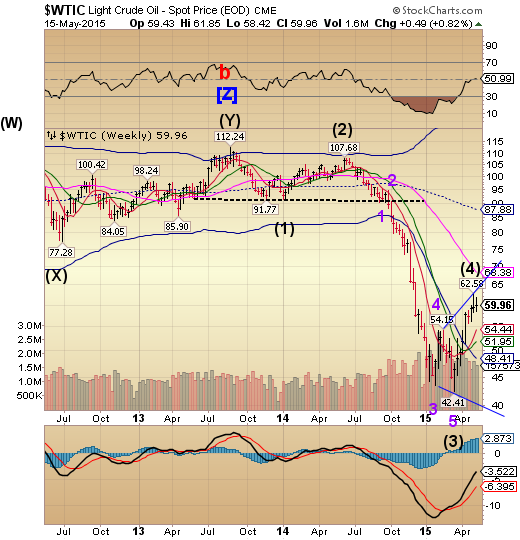
Crude reversed on May 6, in line with the cycles Model after exceeding its target high.The Cycles Model now suggests a sharp decline through the end of May.The near-term target is 40, but it may descend even further.
(TheStreet) -- Oil has gained lots of ground in the last weeks, breaching $60 a barrel twice. But a lot of the reasons for oil's rally could help to scuttle it in the coming months, bringing on a "double-dip" recession and prices falling back to earlier lows.
Overproduction from U.S. shale oil companies was one of several factors that helped to collapse prices in the summer of 2014, and oil companies have been spending the better part of 2015 adjusting to the new economics of oil. Almost all of the U.S. shale producers have slashed budgets to the bone, cutting their capital expenditure budgets by as much as 70%.
With the cut in spending has come a nearly 50% drop in the number of working oil rigs here. In the latest (May 8) report from Baker Hughes), the U.S. is down to 692 working rigs, down from 1,372 rigs in November of 2014.
Shanghai Composite is consolidating beneath its high.
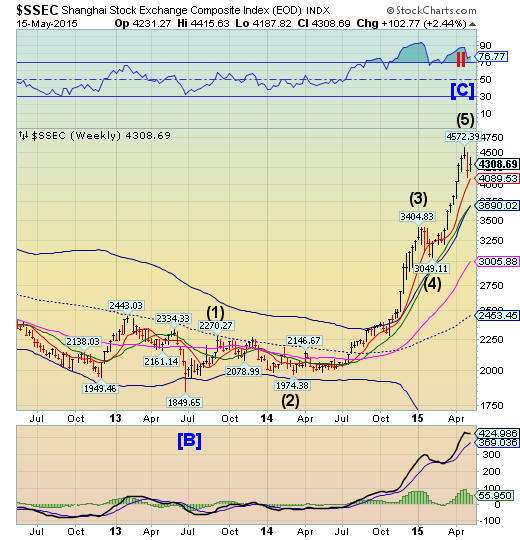
The Shanghai Index appears to have peaked on April 28.Last week the Shanghai consolidated in what is called an “inside” formation, a sign of uncertainty.The next important Cycle Pivot occurs in the last week of May. Should the Shanghai break through supports, especially at 3690.02, the probability of a trend change rises dramatically.
(Reuters) - China stocks slumped on Friday morning after the securities regulator said the market has ample liquidity to handle more initial public offerings, with some interpreting it as a signal that IPO activity could be stepped up further.
The market was also spooked by domestic media reports that state-owned Central Huijin Investment Ltd has been slashing holdings in exchange-traded funds tracking main indexes.
The CSI300 index fell 1.5 percent, to 4,630.94 points at the end of the morning session, on track to close the week up around 1.6 percent.
The Shanghai Composite Index lost 1.4 percent, to 4,315.22 points, bringing this week's gain so far to 2.6 percent.
The KBW Banking Index reaches its Cycle high.
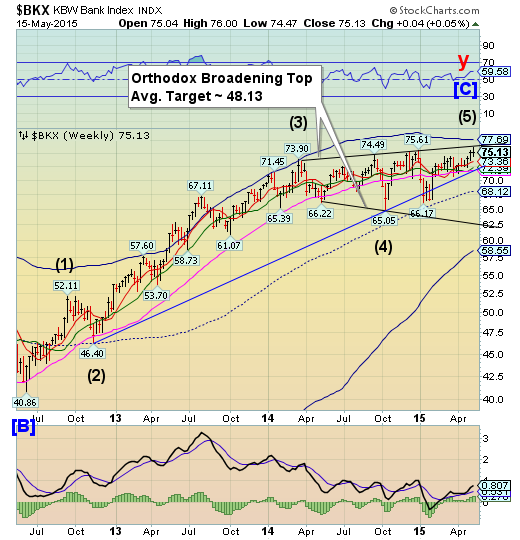
--BKXreached an inverted Trading cycle and Primary Cycle high on Thursday at 76.00.The decline may now begin.Critical supports and its first bearish trigger lie at 72.39, where the 3-year Ending Diagonal trendline lies.Because of the inversion, the Cycles Model now implies that BKX may decline through the end of June
(WSJ) Moody’s Investors Service said on Thursday that it was upgrading ratings for several kinds of debt across three large U.S. banks after it found that it was likely for those institutions to get some government support in a crisis.
The ratings agency assumed that the bank subsidiaries of Wells Fargo (NYSE:WFC), Bank of New York Mellon (NYSE:BK) and State Street Corp (NYSE:STT).would be less affected and record lower losses than other institutions in the event that the Federal Deposit Insurance Corporation put their holding companies into receivership.
That prompted Moody’s to upgrade its ratings for the deposits, bank-level senior debt and operating obligations of Wells Fargo and Bank of New York Mellon as well as the operating obligations of State Street Corp.
(Reuters) Banks want assurances from U.S. regulators that they will not be barred from certain businesses before agreeing to plead guilty to criminal charges over the manipulation of foreign exchange rates, causing a delay in multibillion-dollar settlements, people familiar with the matter said.
In an unprecedented move, the parent companies or main banking units of JPMorganChase & Co (JPM.N), Citigroup Inc (NYSE:C.N), Royal Bank of Scotland Group Plc (LONDON:RBS.L), Barclays Plc (LONDON:BARC.L) and UBS Group AG (UBSG.VX) are likely to plead guilty to rigging foreign exchange rates to benefit their transactions.
The banks are also scrambling to line up exemptions or waivers from the Securities and Exchanges Commission and other federal regulators because criminal pleas trigger consequences such as removing the ability to manage retirement plans or raise capital easily.
