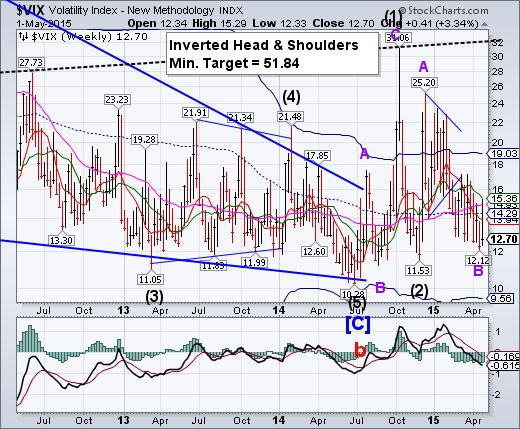
-- VIX challenged ist Intermediate-term resistance at 15.36 this week, but fell back, closing beneath all supports.A close above that resistance level may confirm a sell signal for SPX.
SPX makes a new closing high, reverses.
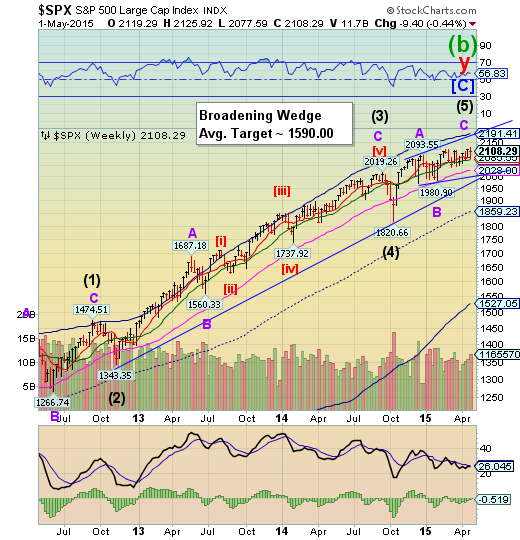
SPX made a marginal new high on Monday, then challenged its Intermediate-term support at 2073.43 but could not close beneath it.The support levels have become dangerously shallow, making it easier to break down.Weekly Long-term support is at 2028.00. The uptrend may be broken at the long-term trendline at 1990.00. The next decline may not be saved at Long-term support as the last one did on October 15.
(Bloomberg) U.S. stocks rose, with the Standard & Poor’s 500 Index paring a weekly loss, as Gilead Sciences Inc (NASDAQ:GILD). and Expedia Inc (NASDAQ:EXPE). rallied after Thursday’s selloff in biotechnology and small-cap shares.
The S&P 500 gained 1 percent to 2,108.04 at 4 p.m. in New York, after falling 1 percent Thursday. The index jumped above its average price for the past 50 days. The Russell 2000 rose 0.7 percent after tumbling 2.2 percent yesterday.
NDX makes a new high, then reverses.
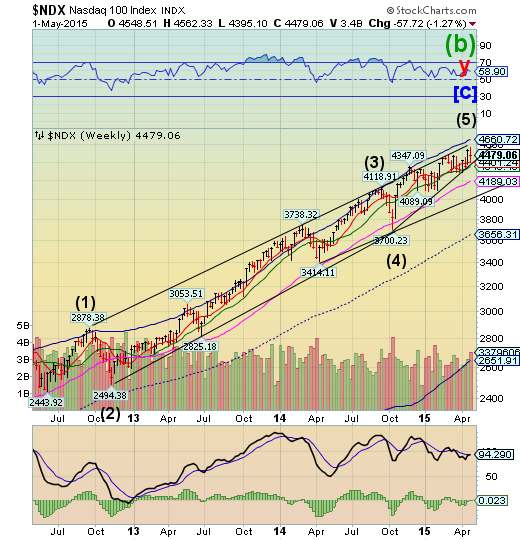
NDX made its final thrust to its high on Monday then sold off, challenging its Short-term support and Ending diagonal trendline at 4401.24.Breaking the trendline implies a complete retracement to its origin at 3700.23.
(ZeroHedge) "Margin loans at high levels, client cash at low levels and account holders at the firm logging in frequently."
If you didn't know any better, you might think the above is yet another example of someone describing one of the dynamics driving China's self-feeding equity mania. After all, the country's "world-beating" rally has everyone from housewives to banana vendors opening stock trading accounts by the millions while piling on margin debt and trading so often that the computers tracking volume literally give up and shut themselves down.
Alas, the quote featured above is actually from TD Ameritrade CEO Fred Tomczyk and he's describing America's own legion of day-trading BTFDers who are apparently all-in at just the wrong time:
A broad look at the 6.5 million customer accounts at TD Ameritrade indicates that retail investors are "pretty fully invested" in stocks, the online brokerage's CEO said Thursday.
High Yield Bonds attempting to make a new high.
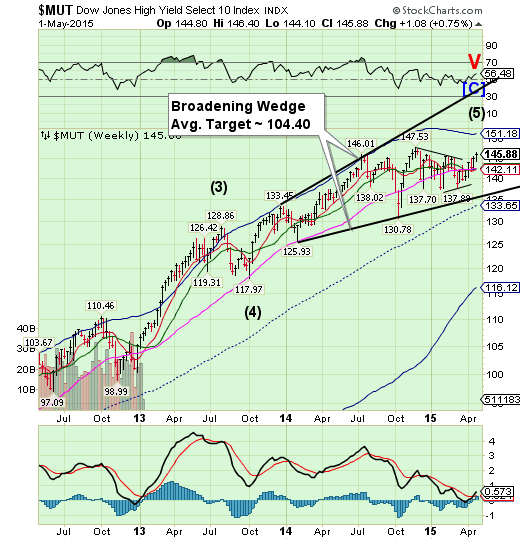
The High Yield Index may attempt a marginal new high next week.That may be a fitting ending to an index that has made a long sideways consolidation since last July. That consolidation turns out to be a Triangle, which calls for a final probe to a new high. There is a probability that MUT may not make a new high above the November 28 high at 147.53. That would be labelled a “truncation.”A failure at this point may cause difficulties in new high yield financing that has supported stock prices during a declining macroeconomic environment. This will not end well.
(Reuters) - Investors worldwide pulled $600 million out of funds that specialize in high-yield bonds in the week ended April 29, marking the biggest outflows from the funds in 14 weeks, data from a Bank of America Merrill Lynch (NYSE:BAC) Global Research report showed on Friday.
Bond funds overall attracted $5.2 billion to mark their 17th straight week of inflows, according to the report, which also cited data from fund-tracker EPFR Global. Treasury inflation-protected securities funds attracted their seventh straight week of inflows, at $300 million.
The euro rally is stronger than expected.
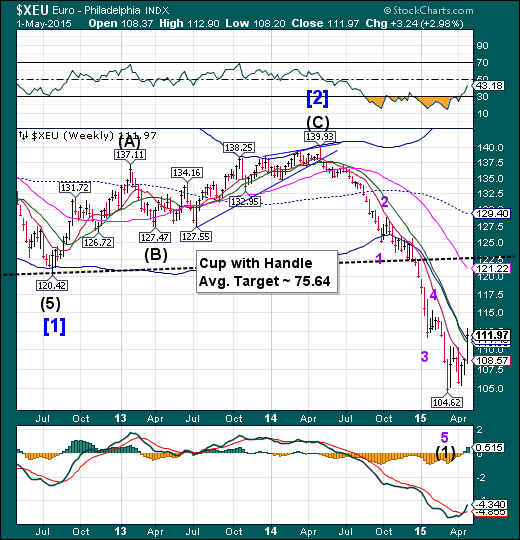
The euro rally has broken through its Cycle Bottom resistance at 111.43.Cycles offer both time and distance in measuring their progress. The euro rally has broken through a formidable resistance with time left to move higher. The rally may last another week and may attempt to reach Long-term resistance at 121.22. Nonetheless, this rally is a bear market retracement and not a new trend.
(Bloomberg) The euro-area economy is riding the biggest wave of liquidity since the birth of the single currency to its fastest expansion in four years.
The long-term laggard of global growth is for now even outpacing the U.S as it cashes in on ultra-loose monetary policy, weakness in the euro and oil prices, fading fiscal austerity, surging stocks and renewed bank lending. Barclays reckons such forces make overall monetary and financial conditions the easiest since the euro began trading in 1999.
Euro Stoxx breaks beneath its cycle Top support.
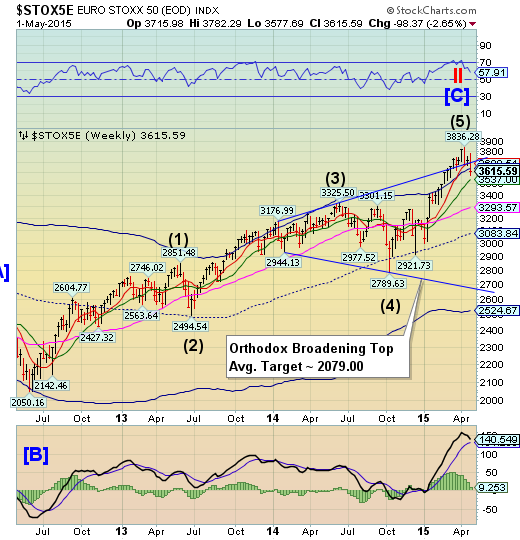
The EuroStoxx 50 declined beneath the upper trendline of the Orthodox Broadening Top and its weekly Cycle Top support at 3643.01.This may be considered a reversal in trend that may receive further confirmation by declining beneath its Long-term support at 3537.00. The Cycles Model suggests a potential panic decline into mid-May to kick off the new trend.
(Bloomberg) A third day of declines pushed European stocks to their first monthly drop of the year, as the Federal Reserve left open the prospect of interest-rate increases even amid weak U.S. growth.
The STOXX Europe 600 slid 0.4 percent to 395.79 at the close of trading, after earlier losing as much as 1 percent. Shares briefly rose 0.2 percent after data showed U.S. jobless claims fell to a 15-year low. European stocks have fallen 4.4 percent from an April 15 record, posting a monthly drop of 0.4 percent, as some companies reported disappointing earnings and talks over Greece’s debt reached an impasse.
The yen still appears weak.
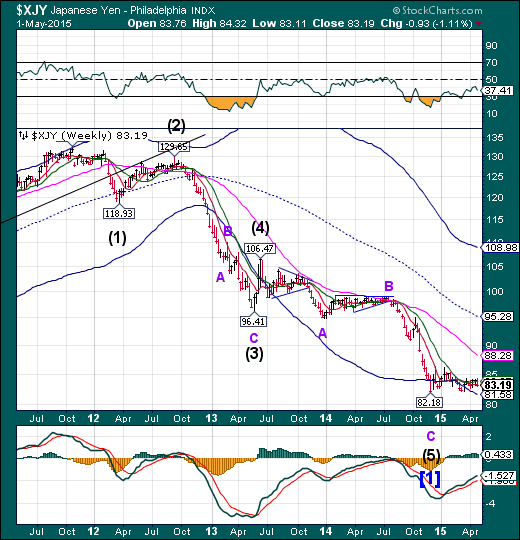
The yen weakened again within its sideways consolidation. All indications point to a probable strong breakout. The Cycles Model suggests a period of strength is approaching. This is the opposite of what many analysts are saying.
(NASDAQ) The Japanese yen retained earlier weakness on Friday after a slew of data that showed an economy struggling to reach a central bank target of 2% sustained inflation.
The data was part of a busy suite due at the end of the week from around the region, even with many countries marking the May 1 labor day, including China which still posted official manufacturing figures as well as services
The Nikkei loses its grip at 20000.
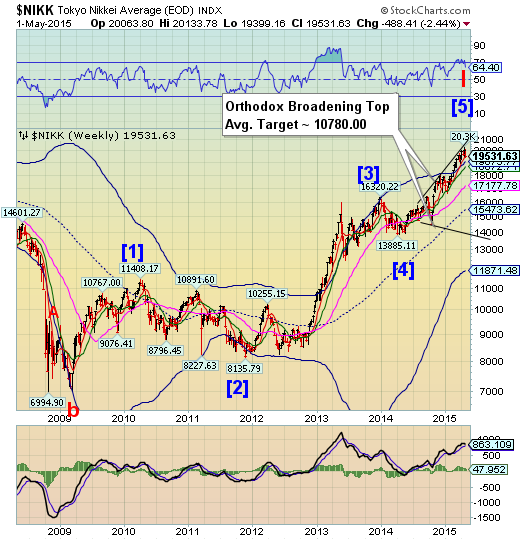
The Nikkei lost its grip of 20000 which represents both round number resistance and its previous high in 2000. A period of weakness is approaching, which may last through mid-May.The reversal may be confirmed with the loss of weekly Short-term and Intermediate-term supports.
(ZeroHedge) Japanese stocks and USD/JPY are back below the lows of the US day-session following The Bank of Japan's decision not to stimulate further (despite all the collapsing economic evidence one might need to do such a thing). Investors were clearly hoping for more (even if economists weren't). With GDP expectations collapsing, BoJ still voted 8-1 not to increase QQE keeping monetary base growth expectations flat. The result is a 500 point drop in the Nikkei from this morning's highs and around 1 handle drop in USD/JPY... for now.
U.S. dollar loses major supports.
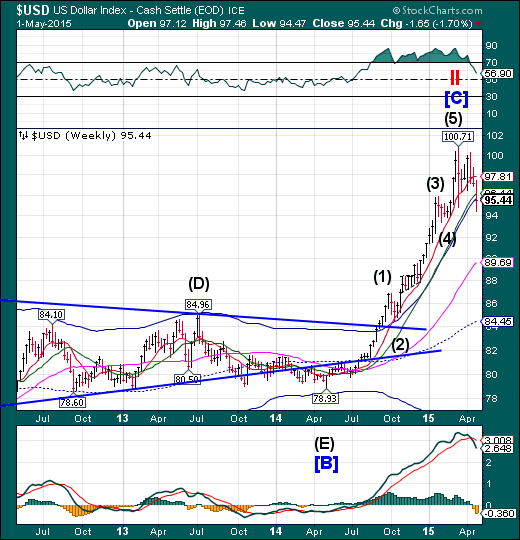
The US dollar broke beneath its weekly Cycle Top support at 95.70 this week.The Cycles Model calls for a continued decline through mid-May, possibly to mid-Cycle support at 84.45. Critical support has been broken. Dollar longs may be crushed in this decline.
(Reuters) - Speculators pared back positive bets on the U.S. dollar, pushing the currency's net long position to their lowest in 4-1/2 months, according to data from the Commodity Futures Trading Commission and Thomson Reuters released on Friday.
The value of the dollar's net long position fell to $34.75billion in the week ended April 28 from $37.87 billion the previous week. Net longs on the dollar declined for a fifth straight week.
It was also the third straight week that longs on the dollar came in below $40 billion.
USB falls beneath important supports.
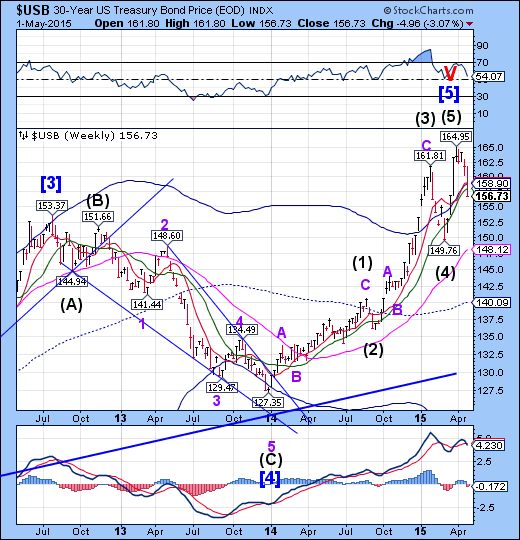
The Long Bond fell beneath its weekly Cycle Top at 158.90 and Intermediate-term support at 157.95. The Cycles Model calls for a possible bounce above Long-term support at 148.12 by the end of the week. If that occurs, we may see an even stronger rally to follow.
(WSJ) Treasury bond prices tumbled Friday for a fifth straight day, capping the biggest weekly selloff in nearly two months.
The yield on the benchmark 10-Year Treasury note settled at 2.119% Friday, the highest closing level since early March, compared with 1.917% a week ago. When bond prices fall, their yields rise.
Friday’s selling was driven in part by a report pointing to stabilization in the U.S.’s manufacturing sector, which spurred hopes that the U.S. economy may regain momentum following a recent soft patch. Investors also expect next Friday’s nonfarm jobs report for April to show solid jobs growth, shaking off the weakness in March.
Gold may trigger its Head and Shoulders formation.
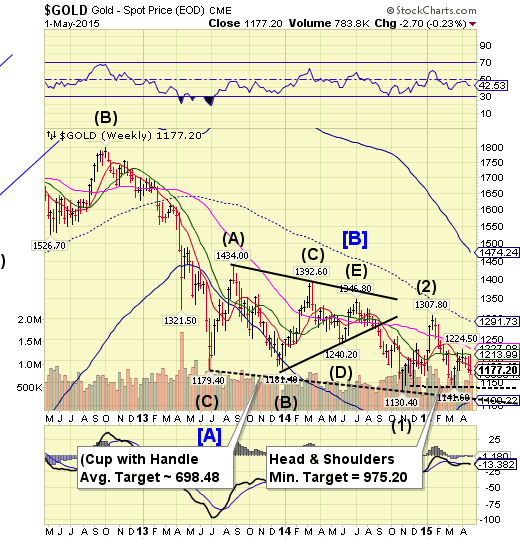
Gold made a final challenge of Intermediate-term resistance at 1213.99 before selling off to a six week low. A failure beneath 1141.60 triggers the Head and Shoulders formation with a minimum target of 975.20.The Cycles Model calls for a probable low by mid-May.
(Reuters) - Gold fell to a six-week low on Friday as the dollar strengthened on U.S. economic data and investor sentiment was undermined by longer-term expectations for a U.S. rate rise.
Technical factors were also at play, with downward momentum gathering pace as prices broke through their April low at $1,175 an ounce.
Major markets in Europe, China and Singapore were closed for the May Day holiday on Friday, with London to close on Monday.
Spot gold was down 0.8 percent at $1,174.11 an ounce at 2:40 p.m. EDT (1840 GMT), after falling 1.2 percent to its lowest since March 20 at $1,170.20. It was on track to close the week down 0.4 percent, its fourth straight week of losses.
Crude completing its retracement.
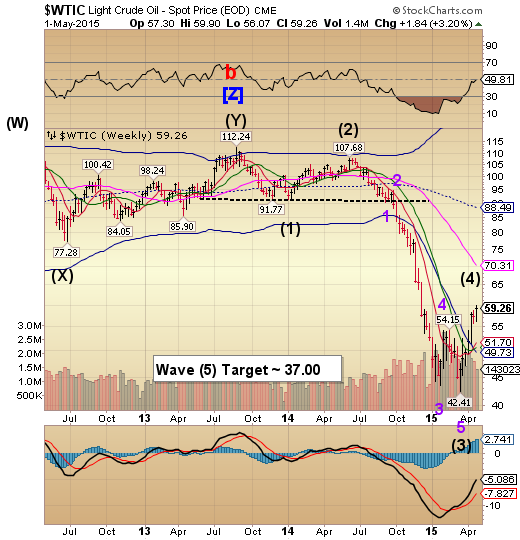
Crude may have completed its retracement today, or at least is in the final stage of completion.The Broadening Triangle Formation suggests a continuation of the original trend. There is a good probability of a further decline through mid-to-late May.
(ZeroHedge) Oil prices have tumbled this morning ahead of the Baker Hughes rig count data but algos bounced them after the pace of oil rig count decline slowed further. For an unprecedented 21st week in a row, the US total rig count declined this week (down 27 to 905). Oil rigs fell 24 to 679 for the fastest total collapse in rig counts in history (down over 57% in 21 weeks). This is a faster pace of decline than the previous week for total rigs but a slower pace of decline for oil rigs.
*U.S. OIL RIG COUNT DOWN 24 TO 679, BAKER HUGHES SAYS
*U.S. TOTAL RIG COUNTDOWN 27 TO 905 , BAKER HUGHES SAYS
If lagged oil prices are any historical guide then the decline is due to stall very soon...
Shanghai Index at a Primary Cycle high?
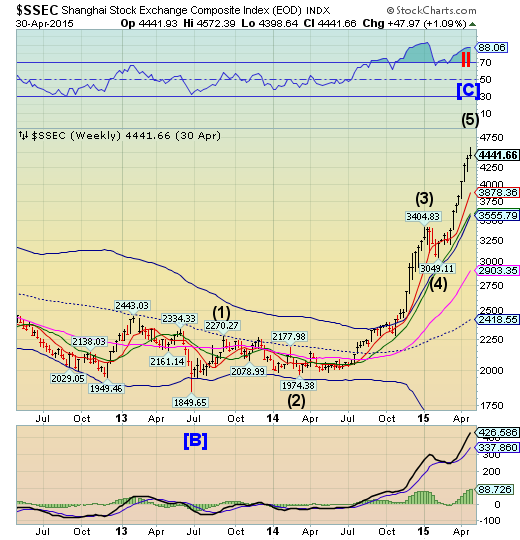
The Chinese markets were closed for May Day celebrations on Friday. The Shanghai Index appears to have made its high on Tuesday, but the reversal is not yet convincing. Retail investors are piling onto this index, which is a good indication of an overbought market.
(ZeroHedge) We’ve written quite a bit over the past two months about capital outflows from China. Last week for instance, we documented how the country saw its fourth consecutive quarter of outflows in Q1, bringing the 12 month running total to some $300 billion. Why, beyond the obvious, is this a problem for China? Because pressure is mounting to devalue the yuan as the currency’s peg to the recently strong dollar is becoming costly for the country’s export-driven economy.
Here’s Soc Gen’s Albert Edwards on the subject:
In the current deflationary environment the Chinese authorities simply can no longer tolerate the continued appreciation of their real exchange rate caused by the dollar link.
The Banking Index hovers at Short-term support.
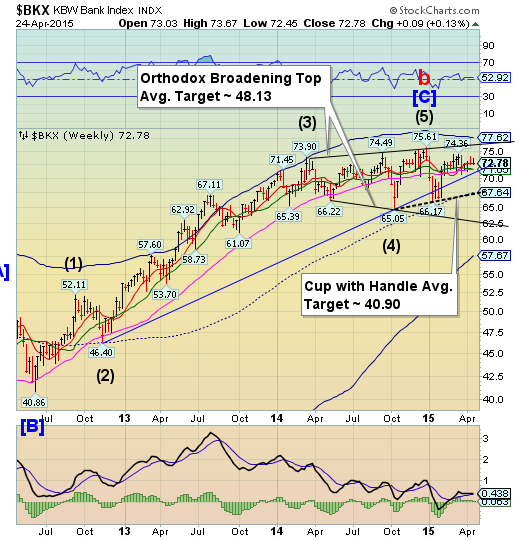
--BKX remained above Short-term support at 72.94, but did not make a new high. This kind of action is bearish but frustrating until supports finally give way. A resumption of the decline may break several critical supports and trigger as many as three bearish formations. The Cycles Model now implies that the next decline may last through mid-May. Could this be a waterfall event?
(CNBC) China's banks are taking over the world, or at least pushing their U.S. counterparts out of the leadership role.
Bank earnings this week in the world's second largest economy paint a dour picture for American financial institutions, according to analyst Dick Bove at Rafferty Capital Markets.
"The Chinese government is now following a policy to allow its banks to expand faster. It has reduced their required reserve ratios," Rafferty's vice president of equity research said in a note to clients. "The United States continues to follow a policy to shrink the biggest banks in this country."
(ZeroHedge) When the Swiss National Bank revealed its long awaited Q1 financials earlier today, everyone was eagerly looking at the number showing just how massive the quarterly P&L loss would be to the central bank following its shocking decision from January 15 to remove its EUR/CHF 1.20 floor, which sent the CHF soaring and by implication caused huge losses to the mostly EUR-denominated SNB assets.The loss was indeed, massive, coming in at CHF 29.3 billion, or $32 billion.
(ZeroHedge) On Thursday we noted that no matter how tempting it may be to tune out the almost hourly warnings from various sources claiming Greece is finally set to run out of cash, one can’t just assume the government will yet again find another couch cushion to reach into in order to scrape up a few more euros to pay government employees and creditors and thereby forestall the inevitable for another few weeks. Eventually, there simply will be no more money and the first signs that Greece has entered the final, terminal phase in the long and painful road to complete insolvency showed up last month in the form of a sweeping decree which required municipalities to transfer excess cash to the central bank.
(ZeroHedge) Anat Admati teaches finance and economics at the Stanford Graduate School of Business and is co-author of The Bankers' New Clothes, a classic account of the problem of Too Big to Fail banks. On May 6th, at the Finance and Society Conference sponsored by the Institute for New Economic Thinking, she will join Brooksley Born, former chair of Chair of the Commodities Futures Trading Commission, to discuss how effective financial regulation can make the system work better for society. Seven years after the worst financial crisis since the Great Depression, Admati warns that we are not doing nearly enough to confront a bloated, inefficient, and dangerous financial system. The system can't fix itself.
