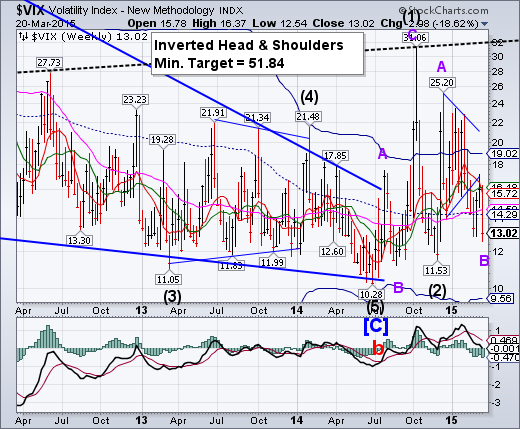
-- VIX reached its lowest point since the first week of December. This was done through a zigzag extension from the February 25 low. VIX goes back on a buy signal (SPX sell) above 14.29 - 14.50. The reversal may be abrupt…
SPX rallies, but no new high.
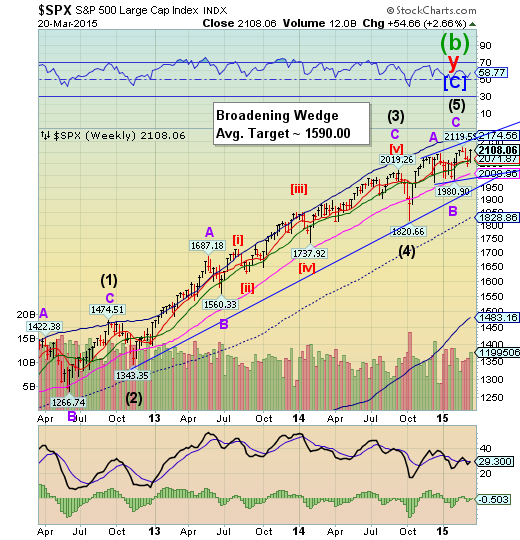
SPX rallied nearly 55 points this week, but could not close at a new high. Should it reverse course next week, it may put its Long-term support in its sights. The uptrend may be broken at the long-term trendline at 1950.00. The next decline may not be saved at Long-term support as the last one did on October 15.
(ZeroHedge) Fresh from a well-publicized dollar dispute with Goldman’s Gary Cohn, recently retired Dallas Fed chief Richard Fisher made an appearance on CNBC Friday and spoke with Rick Santelli. There were quite a number of notable exchanges including the following zingers..
Santelli: “If you had to rate the US economy 0-10 where would you peg it?”
Fisher: “We’re #1., we’re a 10. We’re the epicenter of growth and in the sweet spot.”
Santelli: “Do you think any part of the stock market being high has anything to do with the committee you just left and if you didn’t grade the economy on a curve would you still give it a 10?”
Fisher: “Well, what worries me is how totally lazy investors have gotten, totally dependent on the Federal Reserve and I find this to be a precarious situation.”
Fisher: “Are we vulnerable in my personal opinion to a significant equity market correction? I believe we are.”
NDX bounced off technical supports, but no new high.
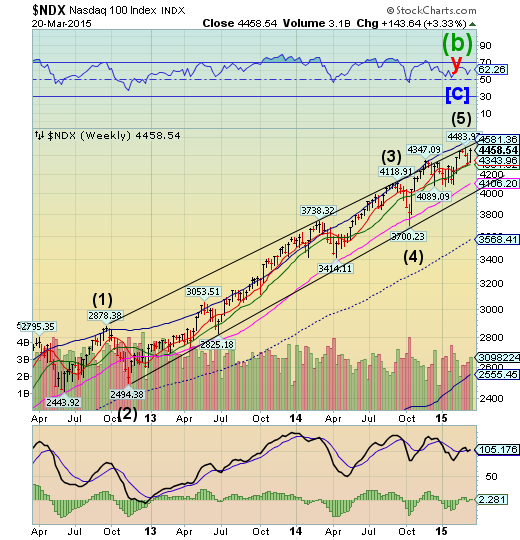
NDX bounced off its double technical support from last week, but did not make new highs.The better part of the rally came after the FOMC meeting on Wednesday.A break of the underlying supports may send the NDX into a deeper decline towards Long-term support at 4106.20 and the trendline..
U.S. stocks rallied on Friday, with the Nasdaq Composite Index closing at its highest level in 15 years.
The Nasdaq Composite climbed 34.04 points, or 0.7%, to end at 5026.42, placing the index within striking distance of its record close of 5048.62, reached in March 2000.
On Friday, the index hit 5042.14, its highest point since the index reached its intraday record of 5132.52 on March 10, 2000. It has been nearly three weeks since the Nasdaq broke through and closed above 5000 for the first time since 2000
“Clearly this year growth is getting rewarded,” said Bob Turner, chief investment officer for Turner Investments, which manages roughly $1 billion. He added that the rise in many technology stocks in the past year has been driven by rapid revenue and profit growth.
High Yield didn’t spill the coffee at the Cup with Handle.
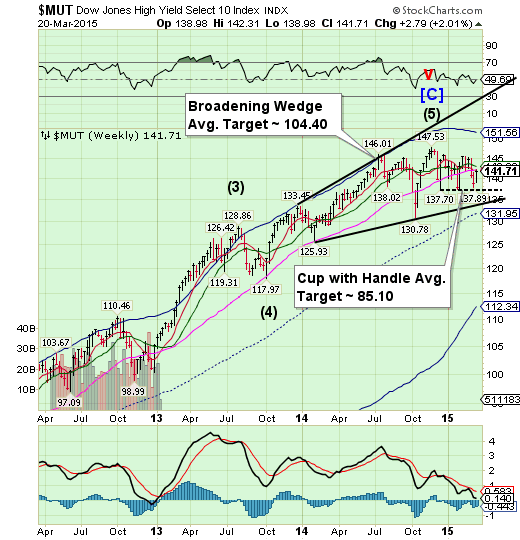
The High Yield Index bounced from the Lip of the Cup with Handle formation at 137.80, but was halted at Long-term resistance at 142.11. The Cup with Handle formation has a very high probability of success once it is triggered.A failure at this point may cause difficulties in new high yield financing that has helped finance stock buybacks, especially in the NASDAQ.
(Forbes) Retail cash flows for U.S. high-yield funds were deeply negative for the second week in a row, with a $1 billion withdrawal in the week ended March 18, according to Lipper. This is roughly half the $1.96 billion withdrawal recorded last week, however, it was entirely tied to the mutual fund segment, with actively managed accounts reporting a $1.38 billion outflow for the week versus a $378 million inflow from ETFs.
Such a large mutual fund withdrawal hasn’t been seen since the week ended Dec. 31, 2014, when a $963 million outflow was reported from mutual funds versus a small ETF inflow. This week’s ETF inflow compares to last week’s huge $1.9 billion ETF withdrawal.
The euro bounced from a long-term support .
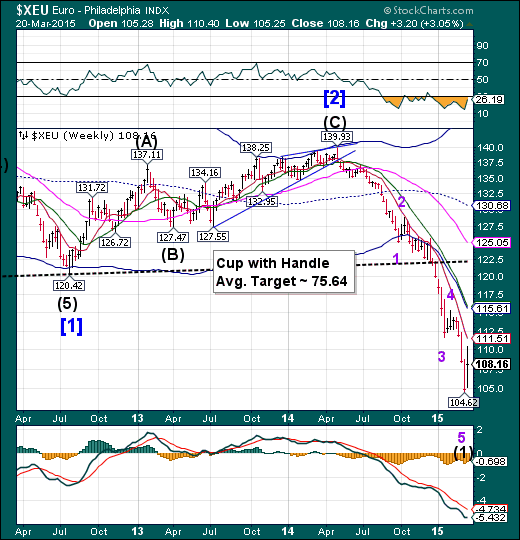
The euro reached its initial downside target of 105.00 in Minor Wave 5 last Friday. The turn came on Monday as suggested last week. It anticipates a bounce that should challenge its Cycle Bottom currently at 115.61 over the next 2-3 weeks.
(Bloomberg) -- The foreign-exchange market is starting to realize the euro’s tumble may not end at parity.
There’s an almost one-in-four chance the euro will end the year below $1, options prices suggest, up from 5 percent at the end of 2014 and 11 percent on March 1, before the European Central Bank started bond purchases that have sent the currency sliding. The euro, which hasn’t fallen below $1 since 2002, was at $1.0745 at 3:01 p.m. in New York, down from last year’s high of $1.3993 in May.
Euro Stoxx overshoots its Broadening Top.
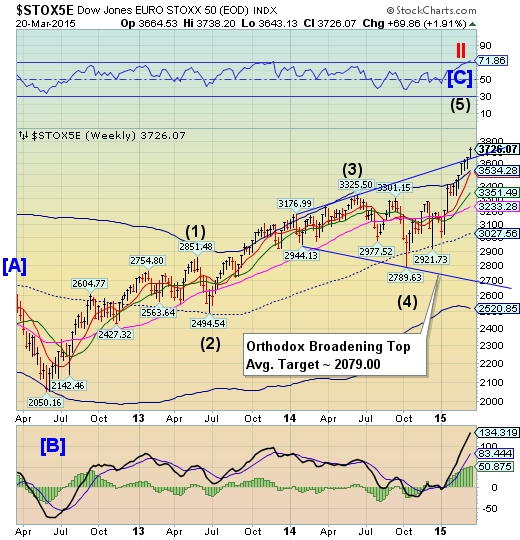
The Euro Stoxx 50 Index appears to have overshot the upper trendline of its Orthodox Broadening Top for a second week. This rally appears to have been dependent on the declining euro. Could a rising euro reverse this trend?
(Reuters) - European stocks rallied on Friday, with euro zone shares easily outperforming again as global investors bet that a weaker euro would boost the region's economy and corporate earnings.
Athens' benchmark ATG index rose 2.9 percent after Greek Prime Minister Alexis Tsipras assured European Union creditors at late-night crisis talks in Brussels that his coalition would soon present a full set of economic reforms in order to unlock cash to stave off bankruptcy.
Outside the euro zone, Britain's top share index FTSE 100 rose 0.9 percent and hit record highs, vaulting above the psychological level of 7,000 points for the first time in its history.
Bank of America-Merrill Lynch said European equity funds had seen $5.4 billion in investment inflows in the past week. That brought total inflows for the last 10 weeks to $42 billion, fuelled by expectations that the European Central Bank's asset-buying scheme would revive growth.
The yen may may be ready for a bounce.
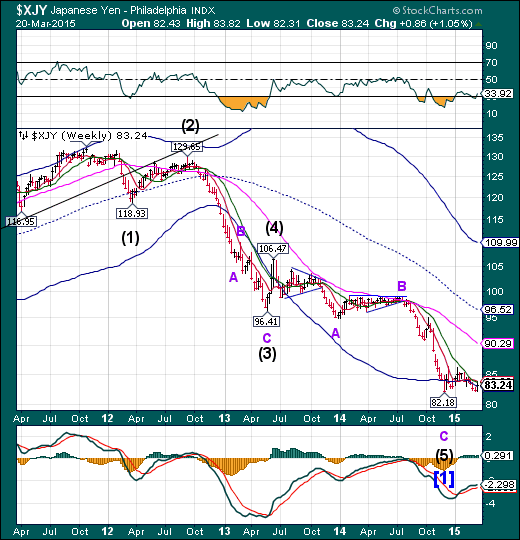
The yen closed above its weekly Cycle Bottom at 83.15 for the first time in a month. The expected Master cycle low arrived last Friday. This may give the Yen the opportunity to rally for up to a month before resuming its downtrend.
(Bloomberg) Feb. 16 -- In today’s “Bart Chart,” Bloomberg’s Mark Barton takes a look at the dollar-yen over the last twelve months on “Countdown.”
The Nikkei is nearing upper trendline resistance.
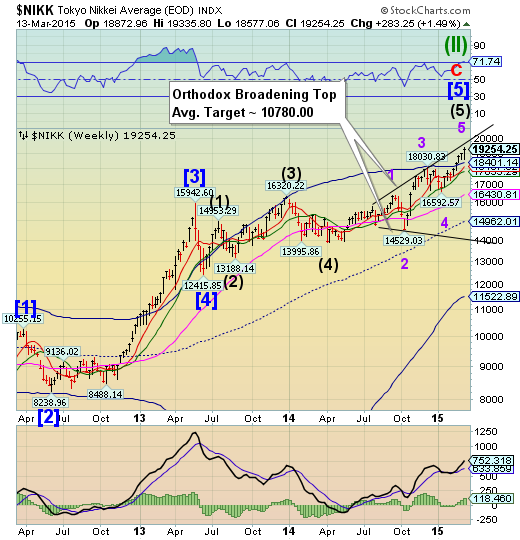
The Nikkei appears to have made a final surge in the week of its 6-year anniversary of the March 9, 2009 low. The risk of a reversal is mounting. The Orthodox Broadening Top agrees with that outcome, since it represents a market that is out of control and has a highly emotional public participation. This may be the start of a dramatic decline that may start imminently.
(Bloomberg) -- Crows circle around the tract of cleared land that was once Hoya Corp.’s Pentax camera plant in Mashiko. All that’s left is a sign directing employees to a dormitory and gymnasium, both pulled down years ago when a strong yen was driving manufacturers abroad.
This was once part of Japan’s industrial heartland, a place that shows little sign of benefiting from Prime Minister Shinzo Abe’s success in weakening the currency and battling deflation. While a 36 percent tumble in the yen has stoked record profits at big exporters like Toyota Motor Corp., the jobs lost here have yet to return.
Mashiko is in Tochigi, one of the prefectures around Tokyo that churned out the world’s gadgets and technology before Japan’s bubble burst in the 1990s and China gradually took over the mantle of production. The region is littered with abandoned or downsized plants, some from companies that are still global brands, like consumer electronics giants Panasonic Corp OTC (OTC:PCRFF) and Sony Corp Ord (NYSE:SNE). Most of the blight stems from the hundreds of smaller suppliers that make up the lion’s share of Japan’s manufacturing.
U.S. dollar reverses abruptly.
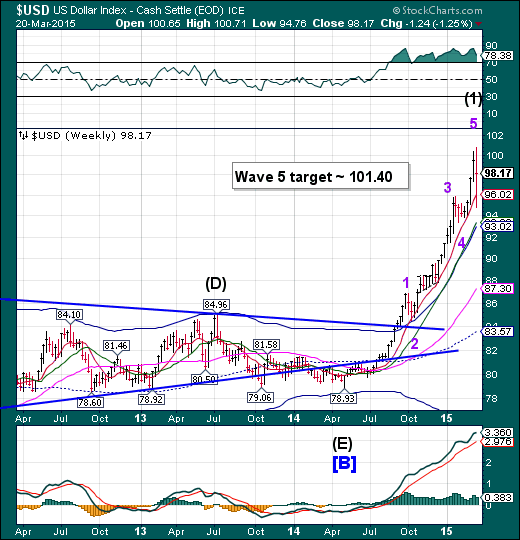
The US dollar made its high on Monday, 69 ticks short of its target at 101.40.The FOMC meeting and news conference on Wednesday was the game changer. The reversal is clear. The USD may see a decline as far as mid-Cycle support at 83.57 over the next few months.
(Reuters) - Positive bets on the U.S. dollar fell to a three-month low in the latest week, according to data from the Commodity Futures Trading Commission released on Friday.
The value of the dollar's net long position totaled $38.59 billion in the week ended March 17, from $44.31 billion the previous week. Net dollar longs fell below $40 billion for the first time in 12 weeks.
To be long a currency is to take a view it will rise, while being short is a bet its value will decline.
Investors had been paring huge long positions on the greenback the last few weeks in the run-up to the Federal Reserve meeting this week.
USB had another good week.
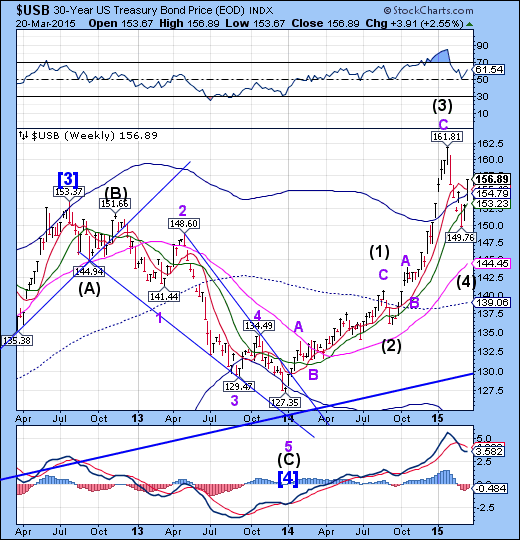
The Long Bond has had another positive week, closing above all resistance areas.Cycle rotation now favors bonds over stocks as a major turn in virtually all assets may be upon us. It appears that this trend may continue through late April before a significant pullback.
(WSJ) U.S. government bonds rallied Friday, capping the biggest weekly price gain in more than three months, as investors expect the Federal Reserve to take its time before shifting toward higher interest rates.
In late-afternoon trading, the yield on the benchmark 10-Year Treasury note was 1.932%, the lowest closing level since Feb. 5, compared with 1.977% on Thursday. Yields fall as bond prices rise.
The yield tumbled by 0.178 percentage point this week, the most on a weekly basis since Dec. 12. It was 2.173% at the end of 2014.
The Fed earlier this week dropped its assurance to keep interest rates low for longer, giving officials flexibility to tighten monetary policy when they see fit. But officials also downgraded the Fed’s growth and inflation outlook while lowering their projections on how high the official policy rate should rise in the coming years.
Gold bounces at a Head and Shoulders neckline.
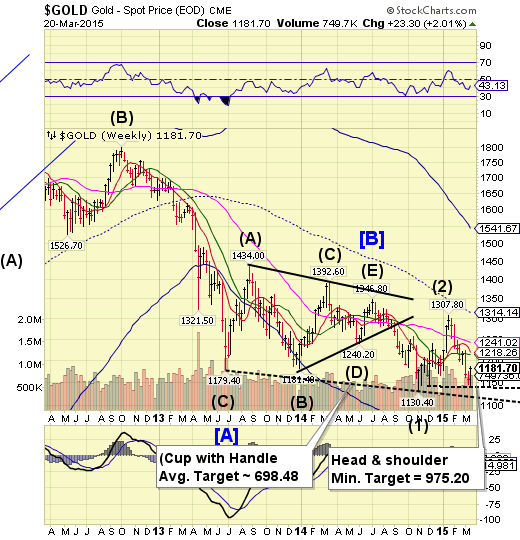
Gold bounced at 1141.50 on Tuesday, but is so far beneath the nearest resistance level at 1213.46 that it may not make it that high in the limited time it has for a bounce. However, whether it ramps higher or not, there is a new Head & shoulders neckline at 1141.50 that, when broken, may lead to a 200 point decline..
(WSJ) Gold prices notched their biggest weekly gain in more than two months Friday, as investors continued to reverse bets against the metal on the heels of dovish signals from the Federal Reserve.
Gold for April delivery, the most actively traded contract, closed up 1.3% at $1,184.60 a troy ounce on the Comex division of the New York Mercantile Exchange. Prices climbed 2.8% this week, their best weekly performance since January.
Fed officials dropped the assurance that it would remain “patient” on raising rates from Wednesday’s post-meeting statement, but they also surprised markets by lowering estimates on future growth and inflation. Gold bulls cheered the central bank’s dovish tilt, as the precious metal has an easier time competing with yield-bearing investments when rates are low.
Crude may now shake out the shorts...
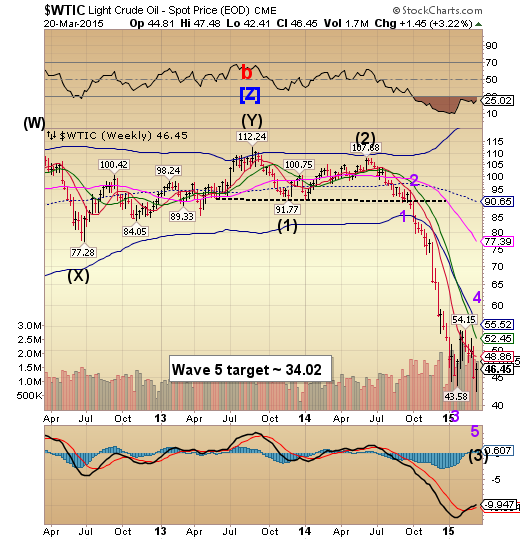
Crude reversed course on Wednesday and appears ready to ramp as high as the Cycle Bottom, currently at 55.52.This may be the real shakeout since the shorts have piled back on. This move has something for everyone, as it went against the longs who piled on last month. Now it may tackle the shorts again.
(Reuters) - Oil prices jumped on Friday with U.S. crude up 4 percent after the dollar fell on interest-rate uncertainty, lifting demand for dollar-denominated commodities from holders of other currencies.
Benchmark Brent oil snapped two straight weeks of losses while U.S. crude had its first positive week in five. Iran's struggle to reach a nuclear deal with world powers also supported oil prices, since it looked as if sanctions on its oil exports would continue.
Contract expiry in U.S. crude added momentum. Traders and investors tried to narrow the price difference between the expiring April contract in U.S. crude and nearby May, which will become front-month from Monday.
Shanghai Index nearing the end of its rally?
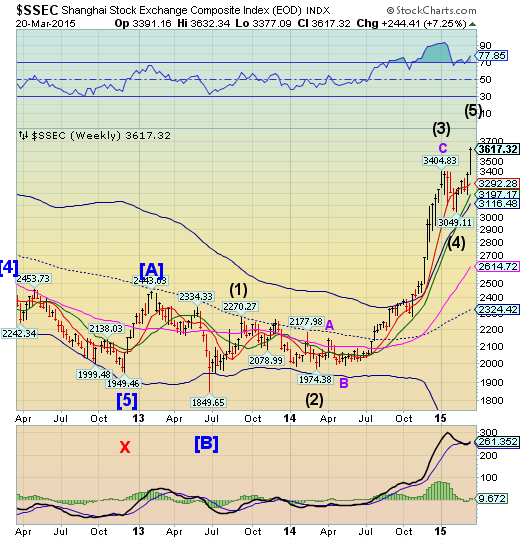
The Shanghai Index appears to be approaching the end of its year-long bull run. The cycles Model suggests a probable turn early next week. China’s real estate market is in shambles and liquidity is drying up, but some large institutions jumped in near the top. Who are they? Read the article below.
(ZeroHedge) The bad news for China is getting worse with every passing day. First it was purely in the financial realm, with both record capital outflows and a crashing housing market leaving the local government-backstopped banks exposed, forcing the PBOC to cut rates not once but twice in 2015, even as sliding wages in China's 4 largest cities confirm the deflationary wave has moved out of the financial arena and has entered the economy proper, something we subsequently confirmed when we showed the latest updated batch of key Chinese charts.
Earlier today we got yet another confirmation of just how truly bad things are for the world's largest (depending on how one counts GDP) economy, when Shanghai Daily reported that fiscal revenue growth slowed in the first two months this year as reduced economic growth dampened tax income and other sources of government revenue.
The Banking Index stalls beneath the highs.
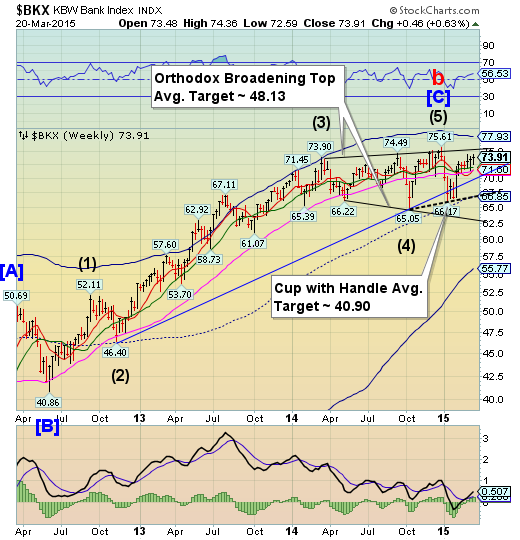
--BKX stalled near the highs without a breakout. In fact, it remains below its year-end high. This is the index that will lead equities and commodities in their next decline.The Cycles Model now implies that the next decline may last through mid-April. Could this be a waterfall event?
(ZeroHedge) In the aftermath of the ECB's QE announcement one topic has received far less attention than it should: the unexpected collapse of risk-sharing across the Eurosystem as a precursor to QE. This is what prompted "gold-expert" Willem Buiter of Citigroup to pen an analysis titled "The Euro Area: Monetary Union or System of Currency Boards", in which he answers two simple yet suddenly very critical for the eurozone questions: which "currency boards", aka national central banks, are suddenly most at risk of going insolvent, and should the worst case scenario take place, and one or more NCBs go insolvent what happens then?
(ZeroHedge) Following yesterday's news that the ECB is now running simulations on what a Grexit would mean for Greek bond prices (spoiler alert:
"fundamentals" suggest a 95% loss), overnight we got more confirmation that Mario Draghi continues to tighten the screws on the Greek sovereign corpse, when Bloomberg reported that the ECB once again raised the maximum amount of emergency liquidity available to Greek lenders by €400 million, but less than the Greek central bank requested, people familiar with the decision said.
(Bloomberg) -- Italy’s biggest banks borrowed more than 30 billion euros ($32 billion) in the European Central Bank’s third targeted-loan operation, about a third of the total.
Banks across Europe took 97.8 billion euros in targeted loans, or TLTROs, offered by the ECB in an effort to stimulate the economy. That compares with 130 billion euros borrowed in in December and 82.6 billion euros in September.
By tying cheap four-year credit to the size of banks’ loan books, the ECB is betting the funds will spur lending to companies and individuals. Italy, the euro-region’s third-biggest economy, is starting to emerge from its longest recession on record, while the government is considering creating a bad bank to accelerate disposals of banks’ problematic assets.
(WSJ) Citigroup Inc (NYSE:C)., Goldman Sachs Group Inc (NYSE:GS)., UBS Group AG (NYSE:UBS) and other large banks face tens of millions of dollars in losses on loans they made to energy companies last year, a sign of investor jitters in a sector battered by the oil slump.
The banks intended to sell the loans to investors but have struggled to unload them even after cutting prices, thanks to a nine-month-long plunge that has taken Nymex crude futures to their lowest level since 2009.
