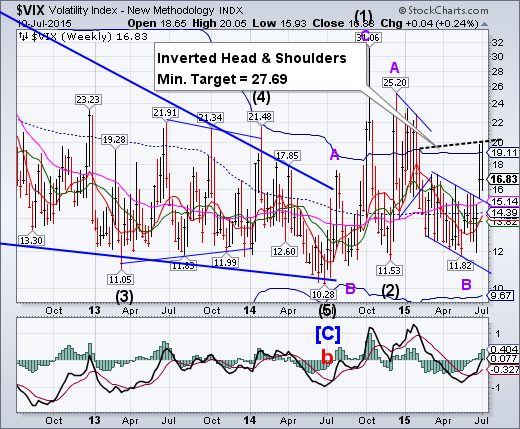
VIX gapped through its declining trendline, giving a confirmed sell signal for SPX. There is a potential Head and Shoulders formation with implications of a much higher outcome once the neckline is exceeded.
SPX challenges Long-term support.
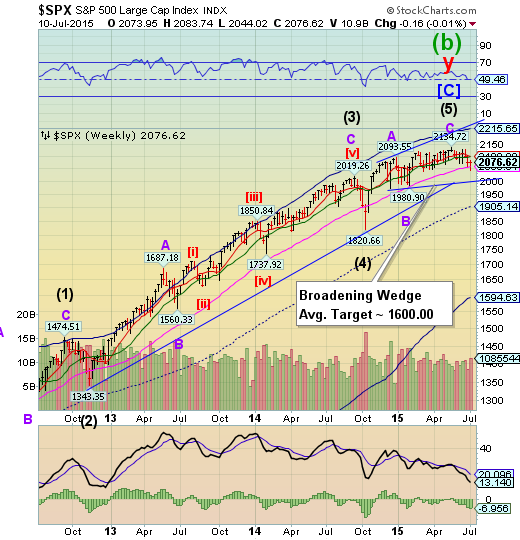
SPX challenged weekly Long-term support at 2058.31 a second time, closing just above it. This leaves SPX on a confirmed sell signal and vulnerable to a drop to or below the Broadening Top trendline and round number support at 2000.00. Despite it breaking even for the week, SPX is showing that a failure to rally here may bring several months of decline.
(WSJ) Stocks on both sides of the Atlantic staged a broad rally, riding a wave of optimism that a deal to tackle Greece’s debt woes could come as soon as this weekend.
Investors cheered news that Greek officials and the country’s creditors were moving closer to an agreement that could keep the country in the eurozone. The latest development offered fund managers some respite from the anxiety that has roiled financial markets in recent weeks, although many investors warned that the outlook could quickly darken, depending on what happens in the coming days.
Friday’s gains allowed the Dow Jones Industrial Average (ARCA:DIA) to eke out a 0.2% gain for the week, which followed two weeks of losses. The blue-chip index rose 211.79 points, or 1.2%, to 17760.41 on Friday.
NDX closes beneath Intermediate-term support.
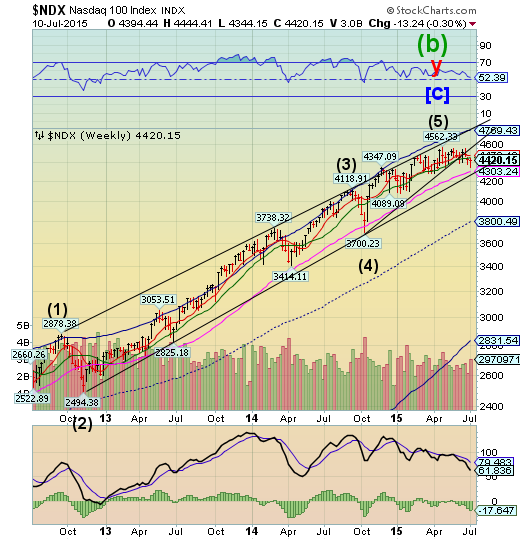
NDX closed beneath its weekly Intermediate-term support at 4451.04 this week, maintaining NDX on a confirmed sell signal. This implies a complete retracement to its October 15 low at 3700.23. The loss of additional supports alters the longer-term view. For example, the loss of the longer-term trendline at 4303.24 suggests a probable retracement to or beneath the origin of that trendline as well. Short sellers aren’t convinced of a sustained decline yet.
(MarketWatch) At the end of the settlement date of June 30, 2015, short interest in 2,294 NASDAQ Global Market SM securities totaled 7,981,483,201 shares compared with 8,089,327,605 shares in 2,280 Global Market issues reported for the prior settlement date of June 15, 2015. The end-of-June short interest represents 5.11 days average daily Nasdaq Global Market share volume for the reporting period, compared with 5.02 days for the prior reporting period.
Short interest in 707 securities on The Nasdaq Capital Market SM totaled 831,261,649 shares at the end of the settlement date of June 30, 2015, compared with 780,034,535 shares in 696 securities for the previous reporting period. This represents 4.11 days average daily volume, compared with the previous reporting period's figure of 4.26.
High Yield Bonds are making new lows.
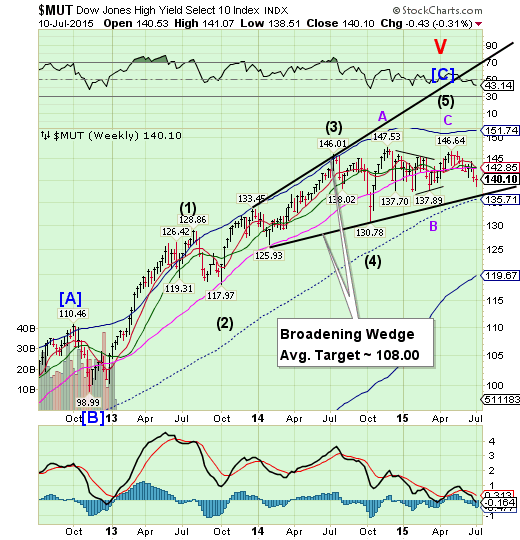
The High Yield Index continued its decline beneath all Model supports this week. It appears destined for the lower trendline of its Broadening Wedge formation. It may have had its Master Cycle low this week, suggesting that a failure to overcome overhead resistance (a bounce) may result in a very serious decline straight ahead. The financing of stock buybacks is being seriously threatened.
(MarketRealist) The issuance volume for high-yield debt for the week ending July 2, 2015, fell from the previous week. Companies remained on the sidelines ahead of the July 4 holiday weekend. They also wanted to assess the results of Greece’s referendum. High-yield debt is tracked by the SPDR Barclays (LONDON:BARC) High Yield Bond ETF (ARCA:JNK) and the iSharesiBoxx $ High Yield Corporate Bond ETF (ARCA:HYG).
According to data from S&P Capital IQ/LCD, dollar-denominated high-yield debt amounting to $1.085 billion was issued in the week ending July 2. The issuance volume fell 80.5% from the week ending June 26. The number of transactions fell to two from ten in the previous week.
The euro challenges Intermediate-term support.
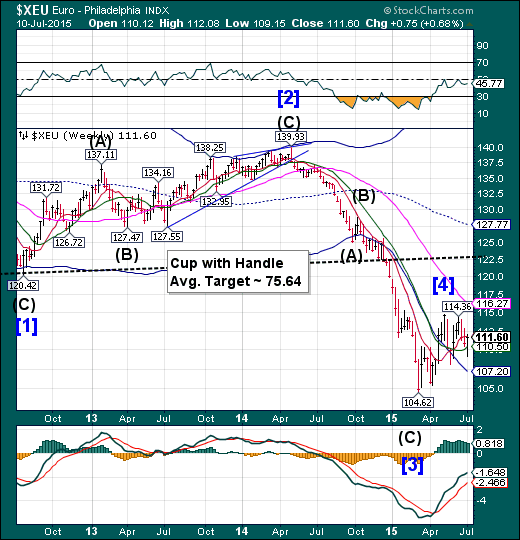
The euro challenged its weekly Intermediate-term support at 110.50 and bounced, but could not overcome Short-term resistance at 111.80 this week. This puts investors on high alert that this weeks action is only a brief interlude. Should it decline beneath Intermediate-term support at 110.50, it may verify that it may be entering a period of weakness lasting for the next three weeks.
(ZeroHedge) I well remember the furrowed brow of President Chirac, sitting amid the splendid gilt furnishings of the Elysee Palace, as I explained to him in May 1998 why I thought the euro would not work as Europe's leaders intended. The charm of his welcome had evaporated as I set out not only why joining the euro would be very bad for Britain, but also far from a good idea for some of the countries desperate to sign up to it.
After I gave my speech that night at my alma mater, the European Business School at Fontainebleau, Chirac and many others were appalled. I said that joining the euro would exacerbate recession in some countries, and that some would find themselves "trapped in a burning building with no exits" - a phrase that brought me a fair amount of controversy and abuse.
EuroStoxx bounced off its neckline.
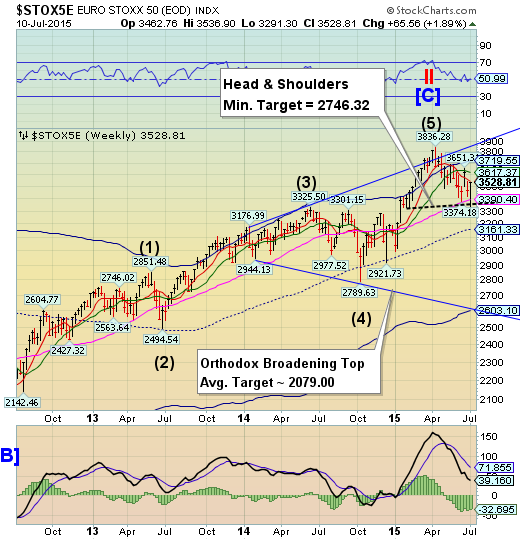
EuroStoxx 50 made a strong bounce from the neckline of a Head and Shoulders formation, but short of Short-term resistance at 3545.00. It remains on a sell signal and breaking neckline support and weekly Long-term support at 3390.40 may bring on a panic decline.
(MisesInstitute) Greece cannot pay its debts ... ever. Nor can several other members of the European Union. That’s why Europe’s elite are loath to place Greece in default. If Greece is allowed to abrogate its debts, why should any of the other debtor members of the EU pay up? The financial consequences of massive default by most of the EU members is hard to predict, but it won't be pretty. Europe has built a financial house of cards, and the slightest loss of confidence will bring it crashing down.
The tragedy of Europe has socialism at its core. Europe has flirted with socialism since the late nineteenth century. Nineteenth century Bismarckian socialism produced two world wars. Leninist socialism slaughtered and enslaved hundreds of millions until it collapsed, mercifully without a third world war. Yet, not to be deterred, in the ashes of World War II, Europe’s socialists embarked on a new socialist dream. If socialism fails in one country, perhaps it will succeed if all of Europe joined a supra-national socialist organization. Oh, they don't call what has evolved from this dream “socialism,” but it is socialism nonetheless.
The yen is struggling at Intermediate-term resistance.
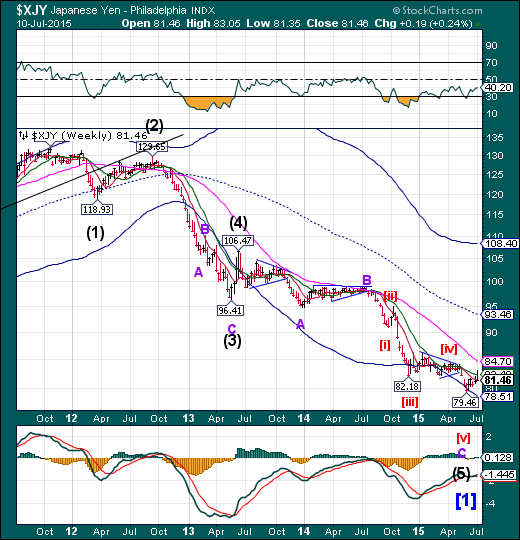
The yen challenged Intermediate-term resistance at 82.40on Wednesday, but fell back to Short-term support at 81.33 for the weekend. A further breakthrough at resistance may reveal a stronger trend that may last through the month of July.
(FT) The Japanese yen regained some status as a haven currency this week, after more than two years of being pushed down by the Japanese central bank. But it is now weakening sharply as Chinese stock markets recover from a rout and nerves about Greece fade.
The yen has fallen a hefty 2.4 per cent against the swiftly rising euro, to Y136.69 per unit of the common currency, writes Naomi Rovnick.
The euro has rapidly regained lost ground after fears that Greece would drop out of the currency union lessened, thanks to Athens submitting a new economic overhaul plan to creditors in its latest attempt to secure a desperately needed bailout.
The Nikkei fell through near-term supports.
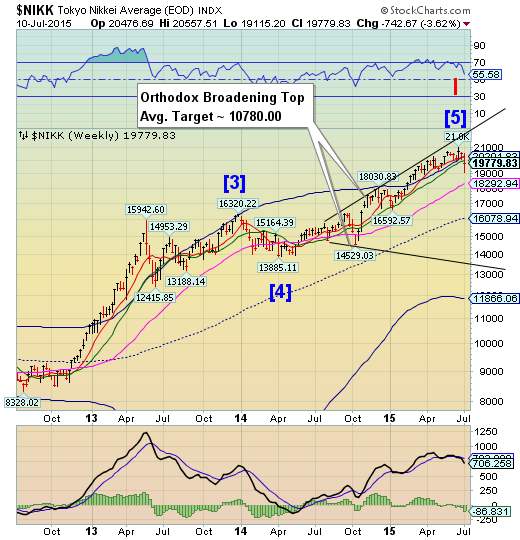
The Nikkei fell beneath its weekly Intermediate-term support at 19956.04. This appears to have arrested the decline on Thursday and partially recovered. We may expect a sharp decline through the better part of July.
(AsiaOne) The 225-issue Nikkei Stock Average temporarily fell more than 600 points from the previous day's closing price on the Tokyo Stock Exchange on Thursday.
The scope of the fall then tapered off. Though the Shanghai and Hong Kong markets started with continuous falling on Thursday, stocks attracted buybacks, and the markets moved into positive territory.
In Tokyo on the day, market prices began falling across the board for the second consecutive day, due to concern about the future prospects of Chinese stocks.
U.S. dollar challenged Intermediate-term resistance.
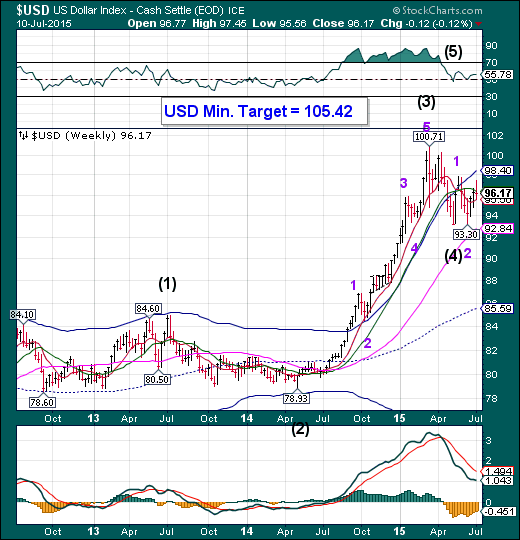
The US dollar rose above Intermediate-term resistance at 96.36, but ended the week beneath it. The next probe higher is likely to break out above its Cycle Top resistance at 98.40. The Cycles suggest a brief correction next week before the rally continues.
(Reuters) Speculators raised bullish bets on the U.S. dollar in the latest week, according to Reuters calculations and data from the Commodity Futures Trading Commission released on Friday.
The value of the dollar's net long position rose to $25.76 billion in the week ended July 7, from $25.11 billion the previous week. This was the fourth straight week net dollar longs came in under $30 billion.
USB rallied sharply, but could not hold Long-term support.
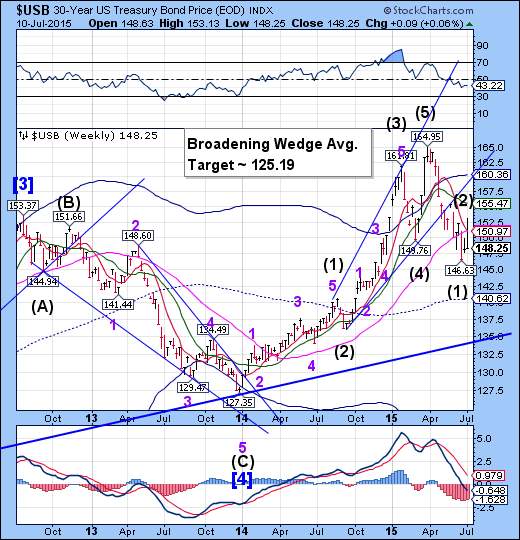
The Long Bond had made a wide swing above Long-term support, then back below it on news from Europe. The bounce in equities late in the week appears to have had its source from Treasuries. The rally fell short of its expectations this week, but may be revived next week.
(WSJ) U.S. Treasury bonds posted the biggest two-day selloff in two years, as fears retreated over turbulence in China’s stock markets and Greece’s debt crisis.
Adding to the pain of the bond market was the latest signal from Federal Reserve Chairwoman Janet Yellen on Friday that the central bank is on track to raise short-term interest rates later this year. A rise in the Fed’s benchmark rates would shrink the value of outstanding bonds.
In late-afternoon trading, the yield on the benchmark 10-year Treasury note was 2.415%, near the highest level since September, compared with 2.301% Thursday and 2.393% a week ago.
Gold bounced from the Head and Shoulders neckline.
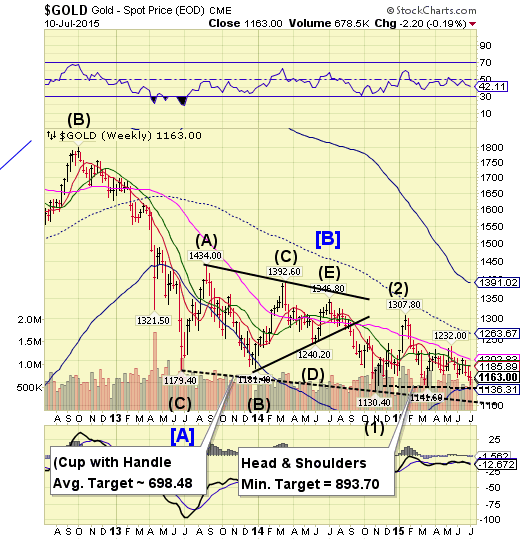
Gold eased down to the neckline of the Head and Shoulders formation, with a minimum target of 975.20, and challenged Cycle Bottom support at 1136.31. The Cycles Model now suggests a substantial decline into late July.
(Reuters) - Gold gave up earlier gains on Friday, after U.S. Federal Reserve Chair Janet Yellen said she expected the central bank to raise interest rates sometime this year, but pointed to concerns that U.S. labor markets remain weak.
In a speech that cautioned about the status of workers as well as some international risks, Yellen gave no direct hint about whether she anticipated more than one rate hike over the Fed's four remaining meetings in 2015.
"(It) looks like a probable interest rate hike scheduled for this year, with or without Greece," said George Gero, precious metals strategist for RBC Capital Markets in New York.
Crude loses Intermediate-term support .
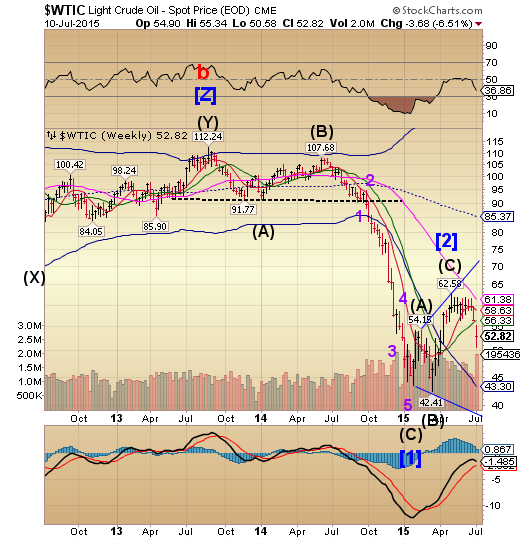
Crude gapped down beneath weekly Intermediate-term support at 56.33 this week. The decline appears to be capable of lasting another week or longer, according to the Cycles Model.
(Bloomberg) Oil capped its steepest weekly loss since March, as the International Energy Agency forecast prices will need to fall further to curb excess supplies.
The world remains “massively oversupplied” before markets tighten in 2016, when output growth outside OPEC grinds to a halt, the IEA said in a monthly report Friday.
Crude has given up this year’s gains following China’s equities rout and the turmoil in Greece. Iran, the fourth-largest producer in OPEC, plans to boost crude exports and recapture market share if international sanctions are lifted. Baker Hughes (NYSE:BHI) Inc. reported that the number of rigs drilling for oil in the U.S. increased this week, potentially exacerbating the glut.
Shanghai Index suffers a 35% decline.
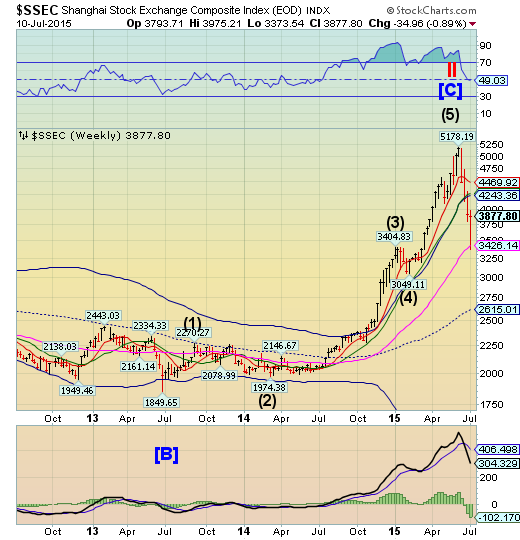
The Shanghai Index declined 35% to its Long-term support at 3426.14 by Wednesday. The bounce has begun and may challenge its Cycle Top at 4243.36. The retracement rally may last another week or so before turning back down.
(ContraCorner) China’s stock market is purportedly all fixed, and the last two day’s 10% bounce is just the beginning. Indeed, Goldman Sachs has already reiterated that the whole thing is on the level, and that the red chips will again be taking flight:
China’s biggest stock-market rout since 1992 has done nothing to erode the bullish outlook of Goldman Sachs Group (NYSE:GS) Inc………Kinger Lau, the bank’s China strategist in Hong Kong, predicts the large-cap CSI 300 Index will rally 27 percent from Tuesday’s close over the next 12 months, as government support measures boost investor confidence and monetary easing spurs economic growth. Leveraged positions aren’t big enough to trigger a market collapse, Lau says, and valuations have room to climb.
The Banking Index bounces between support and resistance.
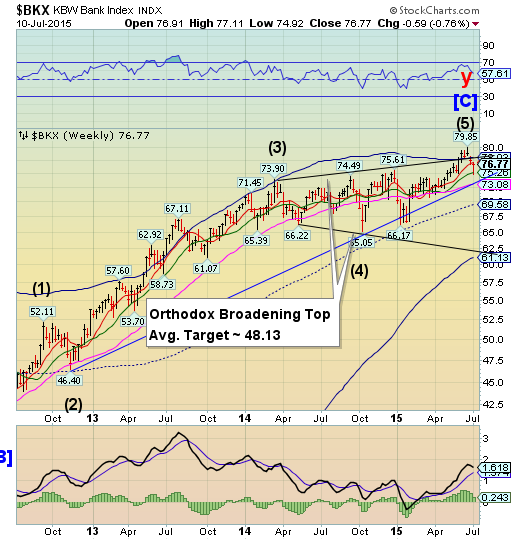
BKX declined to weekly Intermediate-term support at 75.26, bouncing back toward Short-term resistance at 77.14. The expected rally came on Thursday and may last only a few days.
(WSJ) Greece is heading into a weekend of crunch creditor talks, with all involved acutely aware that this time really is the last chance to agree on a bailout deal. The real pressure point in the economy is the banks, which have been closed and offering only €60 ($66) per person a day in withdrawals since Greek Prime Minister Alexis Tsipras called a shock referendum two weeks ago.
The European Central Bank is due to meet again on Monday to decide what to do with the emergency funding that is keeping the banks afloat. Without political support among Greece’s European lenders to help Greece into a third bailout program, ECB President Mario Draghi might find it very hard to keep the Greek banks’ life line in place.
(BusinessInsider) Fan Xiaolin, an engineer in Changsha in central China, thought he was safe when he deposited his family's savings of 800,000 yuan ($130,000) in a private finance company he said was recommended by employees of state-owned Bank of China.
The company, part of an informal industry of lenders and investment managers that operates outside China's state-run banking system, collapsed six months later as economic growth slowed and businesses struggled.
(CNBC) Forget Alcoa: Banks are the new barometer when it comes to the outlook for corporate profits.
Since its exit from the Dow Jones industrial average, the aluminum giant's report no longer is the unofficial earnings season kickoff, nor is the company considered a particularly reliable indicator of broader business trends.
Instead, it is the banks, particularly the Big Four—JPMorgan Chase (NYSE:JPM), Bank of America (NYSE:BAC), Wells Fargo (NYSE:WFC) and Citigroup—that are looked to as bellwethers. With that in mind, the second quarter is turning into one that Wall Street and investors would like to forget.
(ZeroHedge) Two weeks ago, we showed that for all the talk of Greek profligacy and corruption (and there certainly has been a lot of that since Greece adopted the euro in 2001), the reality is that of the €230 billion in Greek bailouts 1 and 2, only 11% of this amount trickled down to the Greek population.
