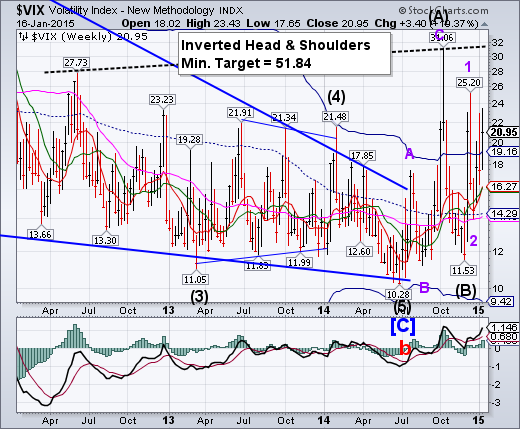
-- VIX rallied above Cycle Top resistance at 19.16 and closed above it. This is the third close above Cycle Top support/resistance since the first week of October. The Cycles Model suggests a probable rally top by the end of January. It may get very exciting.
SPX made a new low but closed above Intermediate-term support.
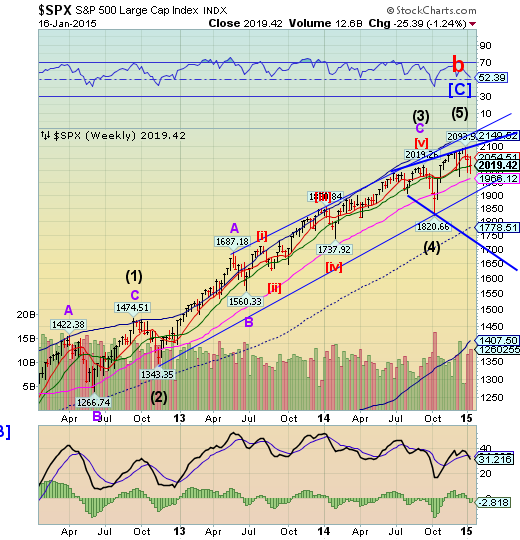
SPX spent a second week beneath weekly short-term resistance at 2054.51. It made a marginal new low, but closed above Intermediate-term support at 2016.98. It appears to be progressing within the Orthodox Broadening Top pattern with Point 6 in its sights, beneath its lower trendline.The Cycles Model low this week was a minor one, but supports have been broken, suggesting a decline to lower values ahead. The depth of the decline may give us some indication of what to expect during the rest of 2015.
(WSJ) U.S. stocks rose sharply Friday, snapping a five-session losing streak and capping a week that saw continued wide swings in share prices.
With a rise in oil prices giving a lift to energy stocks, the S&P 500 added 26.75 points, or 1.34%, to 2019.42.
The Dow Jones Industrial Average rose 190.86 points, or 1.10%, to 17511.57. The Nasdaq Composite Index gained 63.56 points, or 1.39%, to 4634.38.
NDX closed beneath Intermediate-term support.
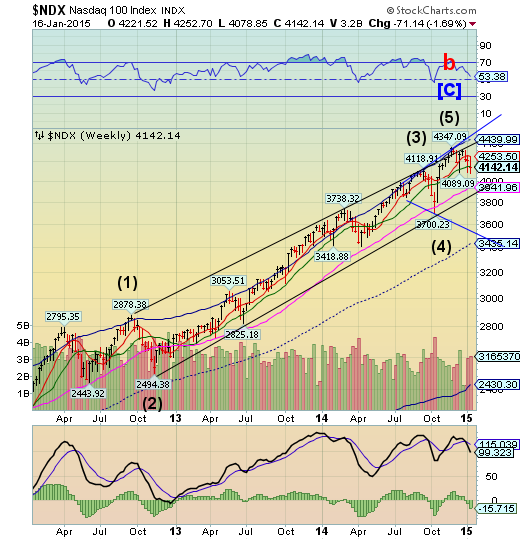
NDX, on the other hand, closed beneath Weekly Intermediate-term support/resistance at 2154.97, capping a loss for the week.It also is progressing within the Orthodox Broadening Top pattern and signals a major change in trend may be underway.
(ZeroHedge) Despite proclamations of stability in oil prices this week, Oil implied-volatility has surged back to new cycle highs this week (near record highs). Credit volatility has been rising for a number of weeks and now equity volatility has been dragged higher (to its highest weekly close since Dec 2012). Thanks to the SNB decision, FX volatility has also exploded this week - the biggest spike since May 2010 to its highest since Dec 2011. Rate volatility remains the least affected for now - though has been on the rise all year and now stands at it highest in 4 months.
High Yield continues challenging Long-term support.
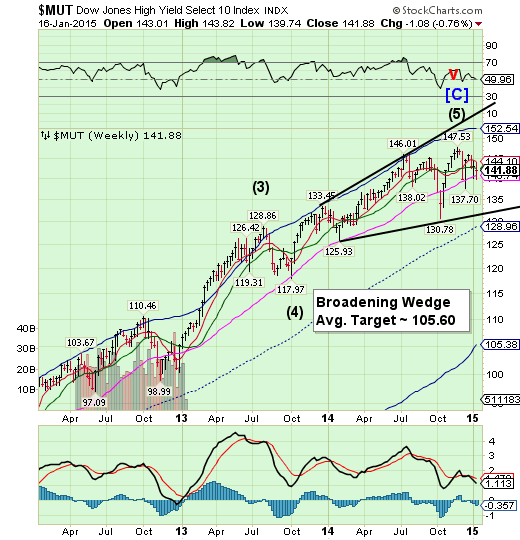
The High Yield Index continued to challenge weekly-term support at 140.74 and closed beneath its weekly Intermediate-term support at 142.88.A decline beneath weekly long-term support suggests a further challenge of mid-cycle support at 128.96 or even lower. Now is time to pay attention to the Broadening Wedge formation as well. A decline beneath the lower trendline puts MUT in motion toward its first target near its Cycle Bottom at 104.65.
(Bloomberg) Investors are easing back into the market for U.S. junk bonds, lured by rising relative yields and the prospect that the economy is growing just enough to keep defaults from accelerating.
About $879.5 million flowed this week into U.S. high-yield funds, snapping six weeks of outflows, according to data provider Lipper. The extra yield paid on junk bonds over Treasuries is 1.3 percentage points higher than its average over the past year.“Higher risk premium has made the market more interesting,” said Christian Hoffmann, a Santa Fe, New-Mexico based money manager at Thornburg Investment Management Inc., which oversees $65 billion. “The macro environment is still far from comforting, but the market has sold off a lot and now there are opportunities to find debt that pay you a lot more.”
The euro continues its free-fall.
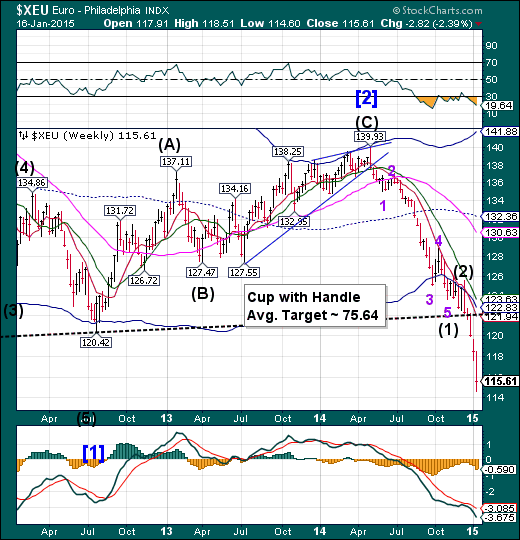
The euro continued lower as it progresses to parity with the US dollar. The euro may not expect its next Master Cycle low until early February, so it may fall quite a distance in the interim. With no supports, the euro is now in a panic decline.
(Bloomberg) The euro is shaping to be the biggest casualty of Switzerland’s decision to scrap its currency cap.
Soon after the Swiss National Bank unexpectedly ended its three-year policy of keeping the franc weaker than 1.20 per euro, bearish bets on Europe’s common currency soared. While setting a record low versus the franc yesterday, the euro also plunged 3.5 percent against a basket of 10 developed-nation peers, the most since its 1999 debut, and reached an 11-year low against the dollar today.
The SNB’s decision removes a key pillar of support for the euro, boosting the odds that its recent slide will accelerate. Companies from Goldman Sachs Group Inc. to Pacific Investment Management Co., the world’s biggest manager of active bond funds, have in recent days talked about the euro falling to parity with the dollar, a 14 percent decline from its current level.
EuroStoxx benefits from the Swiss unpegging.
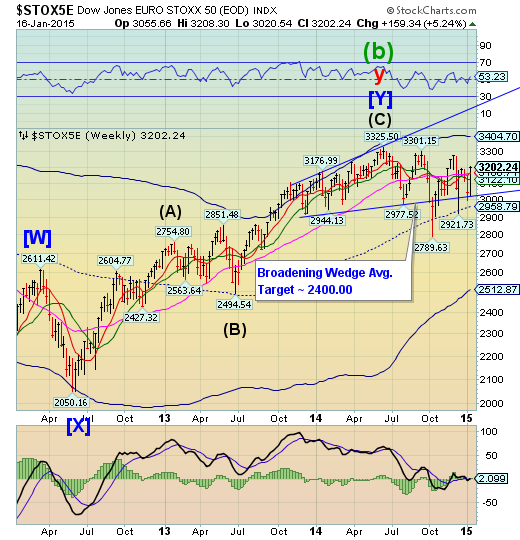
The EuroStoxx 50 Index found support at the lower trendline of its Broadening Wedge, approaching its December 8 high. Taking the Swiss franc off its peg with the euro drove many currency traders back into stocks. The question is, “How high will it go?”
(ZeroHedge) First the good news... European Stocks (ex Greece and Switzerland) exploded higher this week with 'great' nations like Portugal (up over 7%) and Italy (up over 5.5%) and Germany's ADX over 10,000 to record highs. EU bond spreads compressed notably (Spain/Italy down 20bps or so on the week) and EUR/USD crashed below 1.15... all on hopes that the SNB decision means Moar-Massive ECB QE comes next week (not priced in). But the bad news... Swiss stocks collapsed-er again today for the worst week since Lehman. Swiss bond yields are negative to 12 year maturity and EUR/CHF is back below par at 0.9820...
European bonds and stocks are loving it... (buy the hope, sell the news next week?)
The yen rises, but needs a breakout.
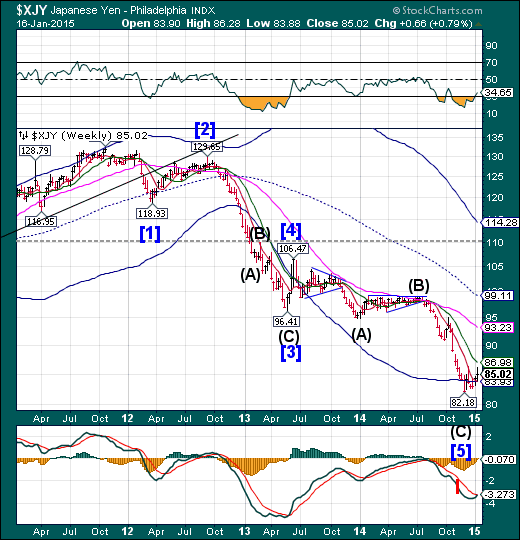
The yen continues higher in small steps. It has yet to overcome its December 16 high at 86.34. Once the breakout occurs, the yen may gain momentum in its rally, since most traders have not recognized a change of trend.
(Bloomberg) The yen has never fallen for four straight years against the dollar and Japan’s former top currency official sees better than 50 percent odds for the yen to halt its declining streak.
While the weak-yen trend from 2012 is still intact, the gap between actual currency levels and purchasing power parity has stopped widening, said Toyoo Gyohten, who was vice minister for international affairs at the Ministry of Finance from 1986-1989. The Japanese currency fell 12 percent in 2014 for a third annual loss, the longest streak since 1997.
The Nikkei closed down for a second week of the year.
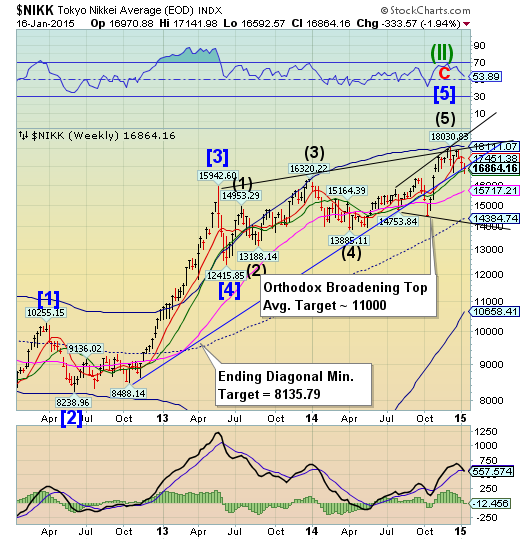
The Nikkei challenged bot the lower trendline of its Ending diagonal and Intermediate-term support at 16759.45 before a weak bounce, closing beneath the trendline. The Orthodox Broadening Top also plays a role in this reversal, representing a market that is out of control and has a highly emotional public participation. A loss of support of the Ending diagonal trendline at 17000.00 and Intermediate-term support may be the start of a dramatic decline that may last up to 3 months or longer.
(JapanTimes) Stocks nose-dived Friday, taking a heavy blow from the yen’s sharp appreciation against other major currencies.
The Nikkei 225 average closed 244.54 points, or 1.43 percent, lower at 16,864.16. On Thursday, the key market gauge rose 312.74 points.
The TOPIX lost 12.87 points, or 0.93 percent, to end at 1,363.73 after climbing 18.62 points Thursday.
Stocks tumbled right after the opening bell, with investors accelerating selling in view of the dollar’s plunge below ¥116 as well as a continued sell-off on Wall Street overnight due to a crude oil price fallback and sluggish earnings reports released by major U.S. companies.
U.S. dollar consolidates before going higher
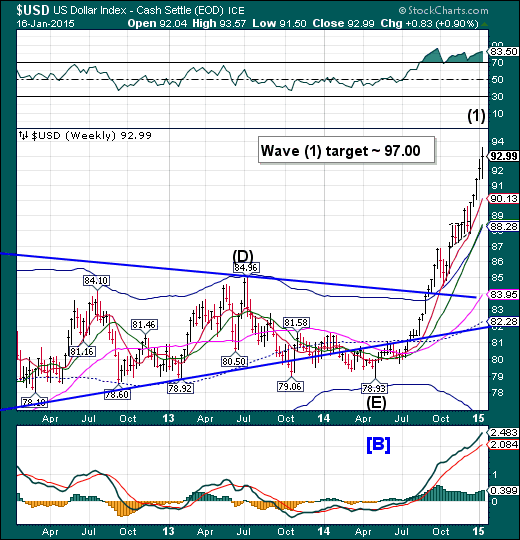
The U.S. dollar pulled back, consolidating its gains, before moving higher. It now appears to have a near-term target near 97.00. The Cycles Model suggests that there may be a Primary Cycle high due at the end of January. A sharp retracement may follow, lasting approximately 3-4 weeks..
(ABCNews) The U.S. dollar has been rolling. Since June 30, its value has jumped 16 percent against a collection of world currencies.
Investors are embracing the dollar because the U.S. economy is strong, especially compared with most other nations.
U.S. economic growth clocked in at a 5 percent annual rate from July through September, the fastest quarterly pace in more than a decade. During 2014, American employers added nearly 3 million jobs, the most in any year since 1999.
Investors also like the safety of U.S. Treasurys, which pay a higher yield than government bonds in Japan and most big European countries do.
USB continues to make new all-time highs.
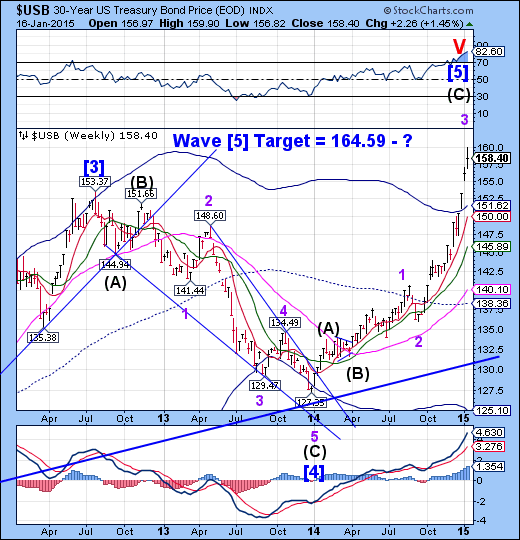
The Long Bond continues to gap higher on a daily and weekly basis. This is typical behavior of a third wave and may continue through early February. .
(Morningstar) U.S. government bonds in the past week posted the biggest price rally in a month as demand for haven bonds climbed over an uncertain global growth outlook and deflation scare in Europe.
The bond market extended its weekly winning streak into a third week. A stunning policy shift Thursday from Switzerland's central bank hammered the country's stock market and generated sharp swings in currencies, adding to investors' anxiety and boosting the allure of holding highly-liquid U.S. government debt.
"People are scared and they want to protect their assets," said Andrew Brenner, head of international fixed income at National Alliance Capital Markets in New York. "Given what the Swiss did yesterday, there is a flight to quality. There is also fear that central banks will not be able to prop up markets forever."
Gold rallies through Long-term resistance.
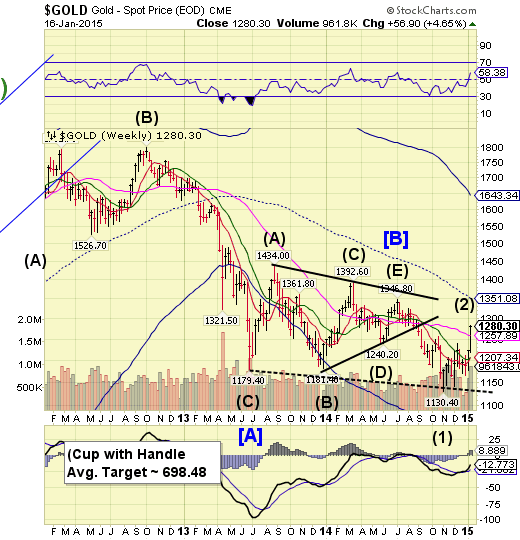
Gold rallied through Long-term resistance at 1257.89 but appears to have completed its retracement. The Primary Cycle Pivot due on Tuesday was overshot due to the unpegging of the Swiss franc. Should gold rally above 1346.80 next week, the pattern may change to something less bearish for the short term.
(CNBC) Gold traded near its highest level in four months on Friday, and despite a slight dip on the day, the precious metal was close to logging its best week of trade in ten months.
Spot gold closed 2.57 percent higher on Thursday, reaching $1,261 an ounce - a level not seen since early September – after the Swiss National Bank (SNB) rocked markets by scrapping its currency peg against the euro.In contrast, gold lost 13 percent against the Swiss franc during Thursday's session, as the currency surged higher.
But commodity analysts were not necessarily excited, with Joni Teves, precious metals analyst at UBS, telling CNBC Friday that it was too early to tell whether the central bank's move was a "game changer" for gold.
Crude continues its decline.
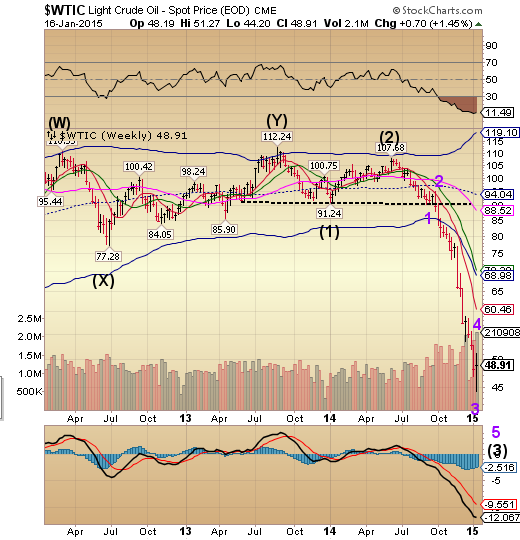
Crude reached an important low on Tuesday, not quite reaching the $43.00 target. In order for the low to remain intact as the Cycle bottom, we must see crude rally for another two weeks or longer. The initial upside target for crude may be its weekly short-term resistance, currently at 60.46.
(MarketWatch) — Crude-oil futures rallied Friday, notching their first weekly gain in eight weeks as the International Energy Agency said collapsing crude prices would cut into supply growth from oil producers outside of the Organization of the Petroleum Exporting Countries.
Light, sweet crude futures for delivery in February CLG5, +4.82% advanced $2.44, or 5.3%, to settle at $48.69 a barrel on the New York Mercantile Exchange. On the week, oil rose 0.7%, snapping a seven-week losing streak.
China may hit a final high next week.
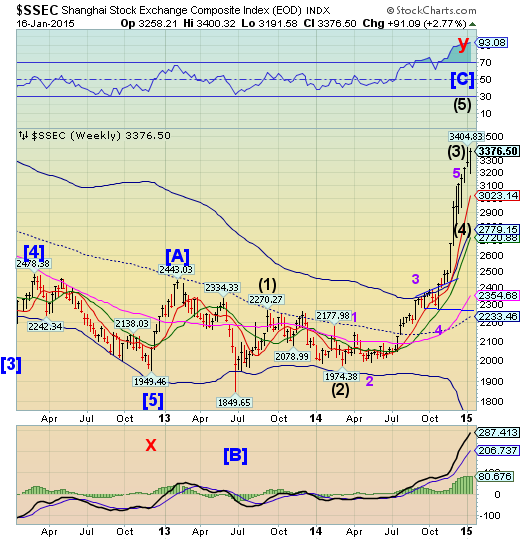
The Shanghai Composite appears to be in need of a final high next week. The Cycles Model suggests a pivot high may be due by mid-week. Last week’s key reversal was not enough to change direction. A new high followed by a decline beneath 3191.00 would confirm the reversal.
(ZeroHedge) As the world’s number one energy consumer China is enjoying the low prices while they last. Never one to settle however, China is finding still more ways to take advantage of the dire straits gripping several oil producers.
China’s slowdown is real – preliminary data suggests 2014 will mark the weakest GDP growth in 24 years – but the country still has plenty of money to play with that is taking it places the World Bank and the International Monetary Fund (IMF) wouldn’t dare. Their reward? More oil of course. With tough conditions and greater access to raw commodities, China looks to turn the high risk into equal or greater returns.
The Banking Index approaches mid-Cycle support.
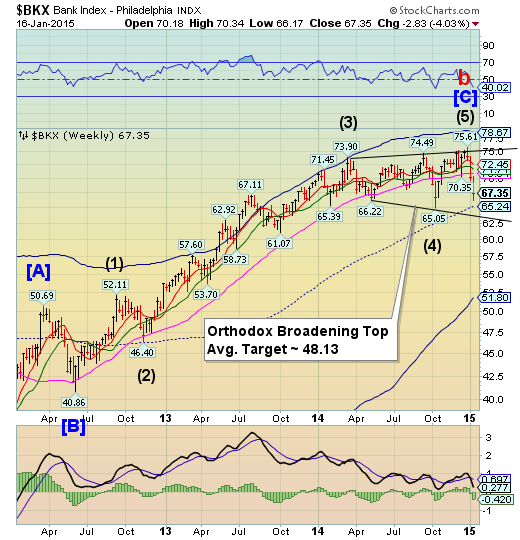
--BKX declined toward weekly mid-Cycle support at 65.24.It now must decline at least 3-5% beneath the lower trendline of its Orthodox Broadening Top at 63.00 to complete point 6 of the formation.The Cycles Model now implies that a significant low may be due in late January to early February that may fulfill those requirements.
(ZeroHedge) While moments ago Greece was downgraded by that paragon of analytical and timing virtue, Fitch, to a negative outlook from stable, that is largely meaningless for a nation, devoid of tax revenues and increasingly deposits, which is suddenly imploding at an ever-faster motion.
What is relevant is that following yesterday's report that two Greek banks had suffered sufficiently material deposit withdrawals to force them to apply for the unpopular and highly stigmatizing Emergency Liquidity Assistance program with the ECB, now the other two of Greece's largest banks have also succumbed to reserve depletion after the Greek bank run appears to have gone viral. As Greek Capital.gr reports, now all four Greek banks have requested ELA assistance from the same ECB president who earlier today is said to have unceremoniously kicked out Greece from the ECB's QE program.
(ZeroHedge) Canary... meet coalmine. While the divergence between US financial stock prices and their credit risk has been significant since Fed's Bullard saved the world in mid-October. In fact the divergence really began when oil prices peaked and began to accelerate lower but really picked up this week after the Swiss National Bank news. Between energy-sector-based structured notes, massive short Treasury positions, and the potential for contagion from Swissy's massive moves, it would appear - judging by the major decompression in US bank credit risk this week to its worst since Feb 2014 – that counter-party risk is on the rise again.
(ZeroHedge) Following disappointing results from JPMorgan Chase & Co (NYSE:JPM) and Wells Fargo & Company (NYSE:WFC) yesterday, it was Bank of America Corporation (NYSE:BAC)'s turn to "surprise" investors with its disclosure just how bad its quarter was. And with the bank reporting a 50% collapse in its sales and trading from Q3, down $600 million from a year ago to just $1.7 billion in Q4, it should come as no surprise that the bank just reported Net Income, before the usual spate of amusing add-backs, of $0.25 well below the $0.31 expected. And while one may argue whether or not BofA's EPS deserve non-GAAP add-backs, it was the Revenue of $18.96 billion, which missed expectations of $21.03 billion by over $2 billion (!) and down $2.7 billion from a year ago, that was truly a showstopper and shows that without the Fed's visible hand manipulating markets every day, banks are a ticking time bomb just waiting to blow.
(ZeroHedge) Earlier today, during the JPM conference call, when Jamie Dimon wasn't busy explaining why the Q4 earnings presentation was sorely missing the page showing JPM's latest Net Interest Margin, a staple placeholder page in the presentation appendix, he found time to lament something totally different. As Bloomberg reports, Dimon lashed out at U.S. regulators for putting his bank "under assault." "We have five or six regulators or people coming after us on every different issue,” Dimon, 58, said today on a call with reporters after New York-based JPMorgan reported fourth-quarter results. “It’s a hard thing to deal with."Have a great weekend!
