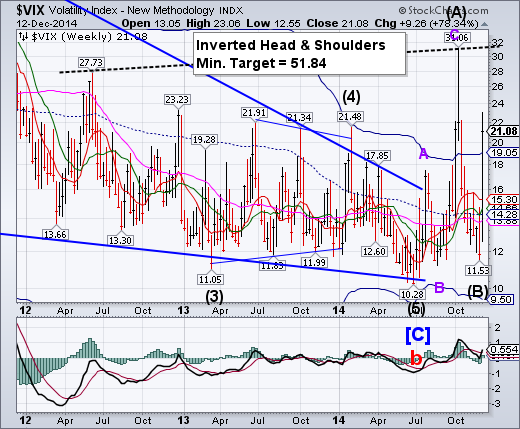
-- VIX rose above Cycle Top resistance at 19.05, giving a clear equities sell signal.It appears that VIX may rise above the Head & Shoulders neckline at 31.06, introducing a new upside target. This may happen rather precipitously next week.
SPX has biggest weekly decline since November 2011.
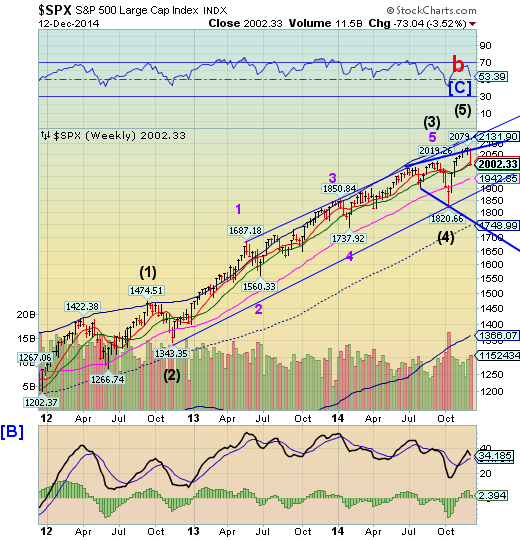
SPX reached a Trading Cycle Pivot on Friday December 5, giving no advance notice of this week’s losses. Itfell from the upper trendline of its Orthodox Broadening Topat 2075.00 and closed just above weekly Intermediate-term support at 2000.65. SPX is on a sell signal, so we may expect further declines next week. The megaphone is a reversal formationhas a unique pattern in which the current decline must drop beneath the lower trendline at 1750.00. Unfortunately, most investors will be unaware of this configuration until it is to late.
(Bloomberg) U.S. stocks sank, with the Dow Jones Industrial Average capping its biggest weekly drop in three years, as oil continued to slide and Chinese industrial data raised concern over a global economic slowdown.
Materials stocks declined the most in the Standard & Poor’s 500 Index, losing 2.9 percent as a group, while energy shares dropped 2.2 percent. International Business Machines Corp., DuPont Co. and Exxon Mobil Corp. sank at least 2.9 percent to lead declines in all 30 Dow stocks.
The S&P 500 lost 1.6 percent to 2,002.33 at 4 p.m. in New York, extending losses in the final hour to cap a weekly drop of 3.5 percent. The Dow sank 315.51 points, or 1.8 percent, to 17,280.83. The Dow slid 3.8 percent for the week, its biggest decline since November 2011.
NDX declining to supports.
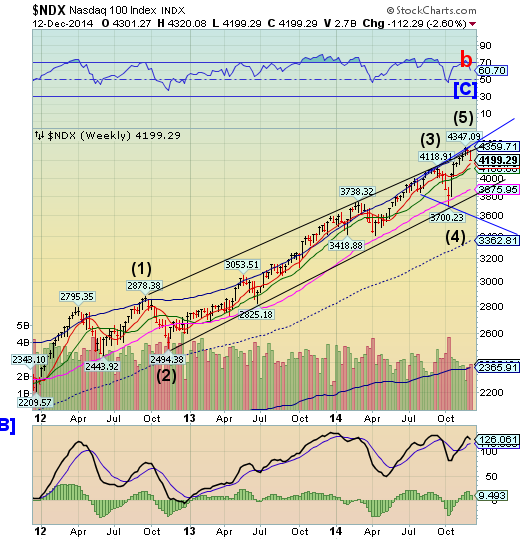
NDX declined toward weekly Short-term support at 4166.79. This “weekly reversal” from last week appears to be morphing into a full-blown decline.The Broadening Top formations in the indexes are bearish reversal patterns that indicate high public participation, peak emotional involvement and no risk control (the “Bernanke put”).A decline beneath the October 15 low at 3700.23 completes the pattern and signals a major change in trend may be underway.Consumersare at the peak of confidence. How soon will it change?
(Bloomberg) Americans brimmed with confidence in early December as they shopped for holiday gifts, signaling retailers will see sales continue to accelerate heading into 2015.
The Thomson Reuters/University of Michigan preliminary December index of consumer sentiment increased to 93.8, the highest since January 2007, from 88.8 last month. The gain exceeded the 89.5 median forecast in a Bloomberg survey of economists, topping the estimate by the most since March 2013.
High Yield drops to Long-term support.
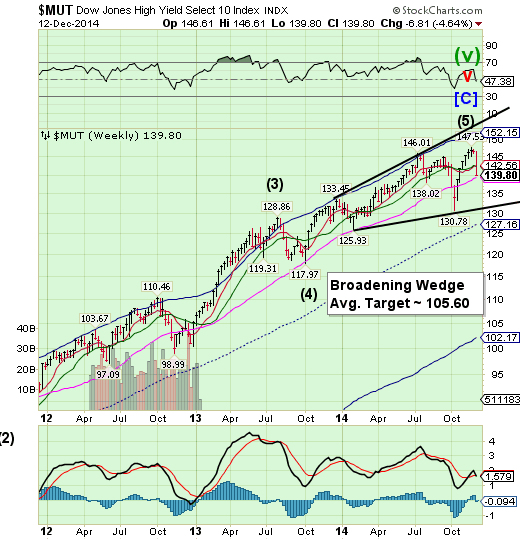
The High Yield Indexdropped this week to challenge weekly Long-term support at 139.26.The next move is likely to be a decline to or beneath mid-Cycle support at 127.16.Now is time topay attention to the Broadening Wedge formationas well.A decline beneath weekly Long-term support at 139.05 and the lower trendline puts MUT in motion toward its first target near its Cycle Bottom at 102.17.
(ZeroHedge) High-yield energy bond spreads are crashing-er. Up 15bps to 880bps today, these are record wides and massively impact the economics of these firms - no matter how much investors want to ignore it. This is contagiously spreading across the broad high yield and even investment grade credit markets as high yield bond prices crash below the mid-October Bullard lows...
HY Energy risk is exploding...
The Euro is still aiming for the trendline.
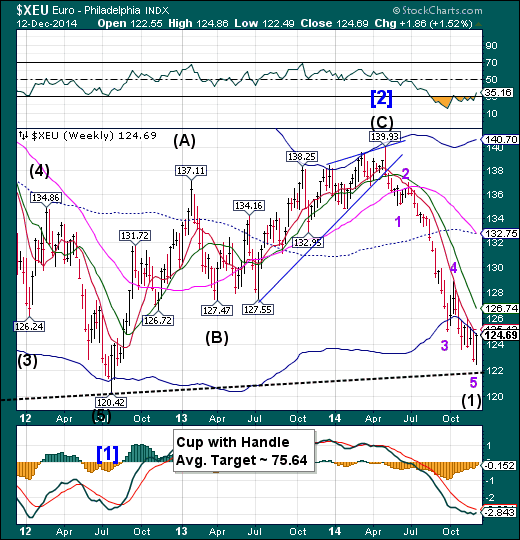
The Euro came within 49 ticks to the Lip of the Cup with Handle formation at 122.00.The Euro may still be attracted to the trendline before it bounces. Long-term trendlines often act as attractors that may produce a bounce when encountered.The next probable Pivot day is on Thursday, where the low for this cycle may occur.
(Bloomberg) The last time Greece’s bonds had this bad a week, the nation had just undergone the biggest debt restructuring in history, inconclusive elections had stoked concern it may exit the euro and Mario Draghi’s “whatever it takes” pledge was more than two months away.
The yield on Greek 10-Year bonds has surged about 200 basis points this week, the biggest leap since the height of the euro-area sovereign-debt crisis in May 2012. Worse still, the yield on3-Year notes, issued in July as part of Greece’s emblematic return to capital markets, have jumped more than 450 basis points, climbing above the longer-dated rates in a sign that investors are increasingly concerned the nation will be unable to pay its debt.
But will Italy leave the Euro???
EURO STOXX (XETRA:SDJE50) begins a Panic decline.
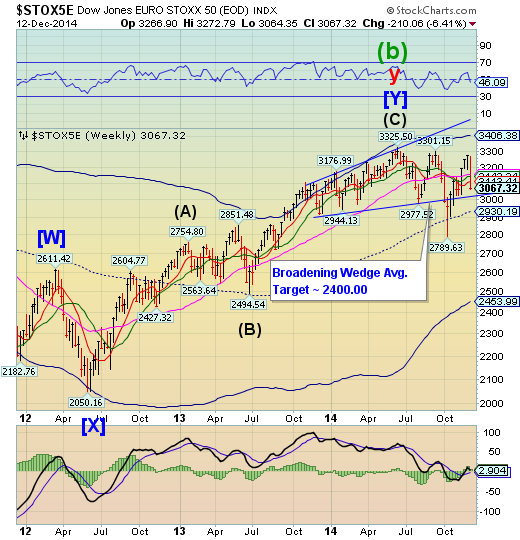
The EuroStoxx 50 Index fell through all Model supports and is very near triggering its Broadening Wedge formation at 3020.00.The reversal may be especially bearish due to the failure to make a new high for the second time and the Broadening Wedge pattern that has a high 94% success rate (source: Encyclopedia of Chart Patterns, by Thomas Bulkowski, P.72).
(Bloomberg) Tumbling oil prices and the worst rout in Greek equities since 1987 sentEuropean shares for their biggest weekly slump in more than three years.
Today’s 2.6 percent plunge in the Stoxx Europe 600 Index was the largest in almost two months and extended the week’s losses to 5.8 percent. That’s more than double the five-day drop in the MSCI Asia Pacific Index and Standard & Poor’s 500 Index.
With oil tumbling to a five-year low, European energy companies slumped to their lowest level since April 2009 and commodity producers had their worst week since May 2012. In Greece, anxiety that voters will kick out leaders committed to the nation’s bailout sent the ASE Index down 20 percent, making it this year’s worst performing equity market after Russia.
The Yen reverses from its Cycle Bottom.
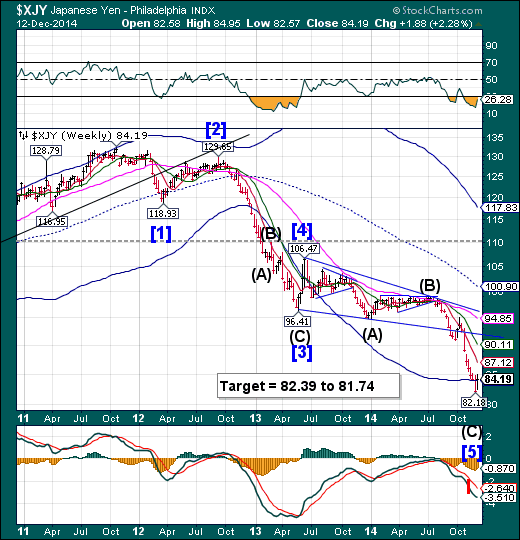
The Yen had a reversal week, closing above the Weekly Cycle Bottom support at 83.97.The Panic Cycle Pivot last weekend had its effect.The rally that follows may take XJY back to 110.00 or higher. It appears capable of extending its rally through mid-January. This means a major source of market liquidity is drying up.
(Businessweek) The yen had its biggest weekly advance against the dollar in 16 months as the market contagion from the rout in crude oil prices drives investors to haven currencies and Japan prepares for national elections.
The Japanese currency appreciated as much as 0.5 percent to 118.05 per dollar before trading at 118.75 per dollar at 5 p.m. New York time. It strengthened 2.3 percent on the week, the most since the period ended Aug. 9, 2013. The yen declined 0.5 percent to 147.99 per euro, and the dollar weakened 0.4 percent against Europe’s shared currency to $1.2462.
The Nikkei also reverses.
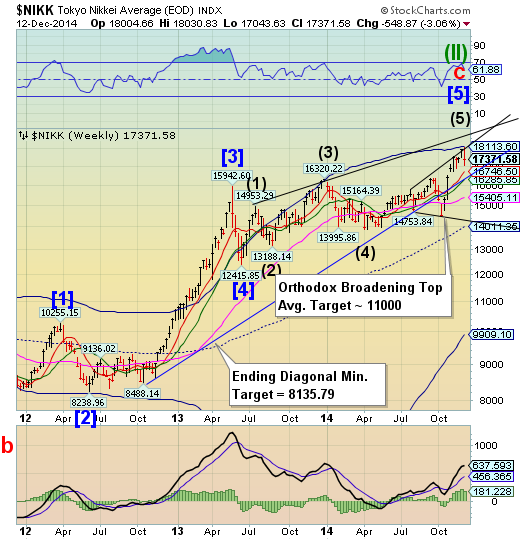
The Nikkei has achieved its Cycle Top resistance at 18113.60, then fell toward Model supports.It appears that the upper trendline of its Orthodox Broadening Top has provided stiff resistance. The Broadening formations represent a market that is out of control and has a highly emotional public participation.Last weekend’s dual Trading Cycle Pivot appeared to have enough force to stop the rally.
(ZeroHedge) Once upon a time, the world's biggest government pension fund, Japan's $1.1 trillion Government Pension Investment Fund, or GPIF, was apolitical, and merely focused on preserving the people's wealth.
Then everything changed, and with the reckless abandon of a junkie on a crack cocaine binge, aka Abenomics, the GPIF management was kicked out, and its entire mandate was flipped from preserving wealth, to gambling on #Ref! P/E stocks, in hopes of recreating the wealth effect of the super-rich…
US Dollar Index may be nearing a completed rally.
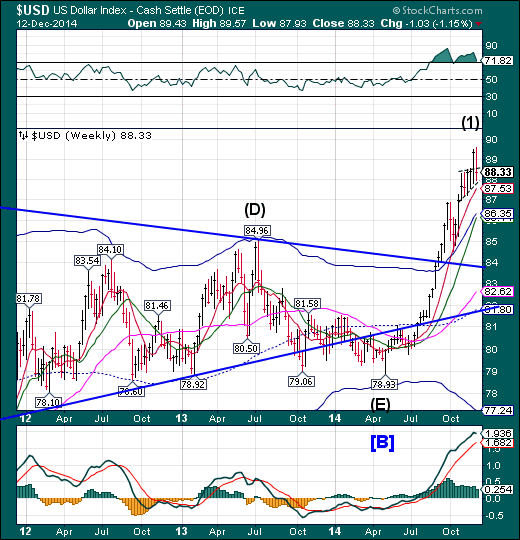
The US Dollar may be nearing completion of its initial rally off the May low.USD is approaching a Primary Cycle Pivot at the end of next week, but may turn at any time.A sharp retracement may follow.
(Reuters) - The dollar was firmer against most of its major peers early on Friday thanks in part to upbeat U.S. retail sales data, while nervousness over falling oil prices kept the Canadian dollar pinned near a five-year low.
Crude Oil slid below $59 a barrel for the first time in over five years, extending a sharp decline that prompted a surprise interest rate cut from the Norwegian central bank on Thursday.
The greenback climbed as high as 119.55 yen USD/JPY, bouncing off a two-week low of 117.44, after a closely watched report showed U.S. retail sales rose a forecast-beating 0.7 percent in November. It has since drifted back to 118.92.
USB is attracted to its Cycle Top.
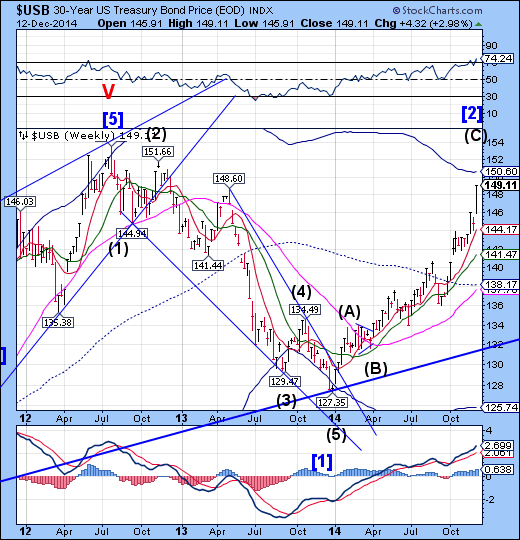
The Long Bond continues to be attracted by its Cycle Top at 150.60, where it may meet its ultimate resistance next week.The ensuing declinemay take USB up to three months to complete.The potential target may be weekly Cycle Bottom support at 125.74.
(Morningstar) Investors piled into government bonds in the U.S., Germany and the U.K. Friday as continued selling in crude oil and disappointing data out of China added to anxiety over the global economy.
Surging demand sent 10-year bond yields in these three countries--benchmarks used to set borrowing costs for consumers and businesses in the U.S. and Europe--tumbling. Yields fall as prices rise.
The yield on the 10-Year U.S. Treasury note fell to 2.102% from 2.178% a day earlier. It is the lowest closing level since October 15 when the yield closed at the year's low--2.09%.
The flight for safety underscores growing anxiety among investors over the uneven pace of the global economy, which has sent the 10-year Treasury yield down from 3% at the start of January.
Gold broke above its consolidation.
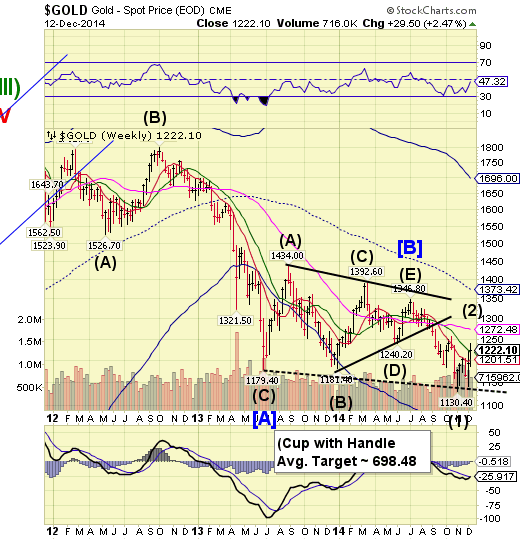
Gold broke above weekly Intermediate-term resistance at 1218.45 where it found closing support. The Cycles Model suggests another week of rally to Long-term resistance currently at 1272.48 before turning back down in an Intermediate Wave (3). There is a potential triple Cycle Pivot on Thursday, which may prove to be compelling. The Lip ofa Cup with Handle formationhas been modified to accommodate the new pattern.
(Bloomberg) Gold prices fell for a third day as gains for the U.S. economy cut demand for the metal as a haven.
The Thomson Reuters/University of Michigan preliminary December index of consumer sentiment increased to 93.8 from 88.8 last month. That beat economists’ projections. Bullion also declined today as crude futures retreated, cutting demand for gold as a hedge against rising consumer costs.
Futures slumped to a four-year low in November as U.S. growth accelerated, equities rallied and the dollar climbed. Gains for the labor markets are increasing speculation that the Federal Reserve is getting closer to raising interest rates, reducing the allure of gold, which generally offers investors returns through increasing prices.
Crude is exceeding its downside targets.
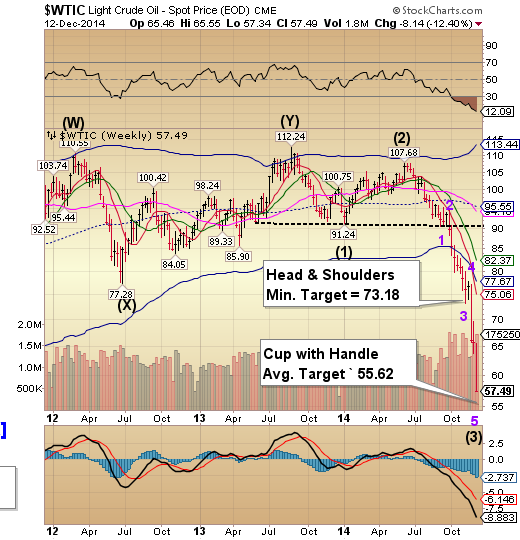
Crude exceeded an intermediate-term target for this week that was given to subscribers. Minor Wave 5 is incomplete and may be an Ending diagonal that could require one more brief bounce back to 60.00followed by a panic decline (10% or more) before the Diagonal is complete. Upon completion, WTIC may exceed the Cup with Handle target illustrated on the chart. If the Cycles Model (or its interpretation) is correct, we may see the decline completed by the end of December.
(Bloomberg) Benchmark U.S. oil prices extended losses below $58 a barrel as the International Energy Agency cut its global demand forecast for the fourth time in five months.
West Texas Intermediate crude capped a weekly decline of 12 percent while Brent lost 10 percent. The IEA reduced its estimate for oil demand growth in 2015 by 230,000 barrels a day, the agency said in a report today. U.S. output, already at athree-decade high, will continue to rise in 2015, the IEA said.
“In the short term, supply is still stronger than demand,” said Gareth Lewis-Davies, a London-based analyst at BNP Paribas SA. “We are going to see further inventory builds in the first half, hence the realization of further pressure on oil prices.”
China stocks reverse course.
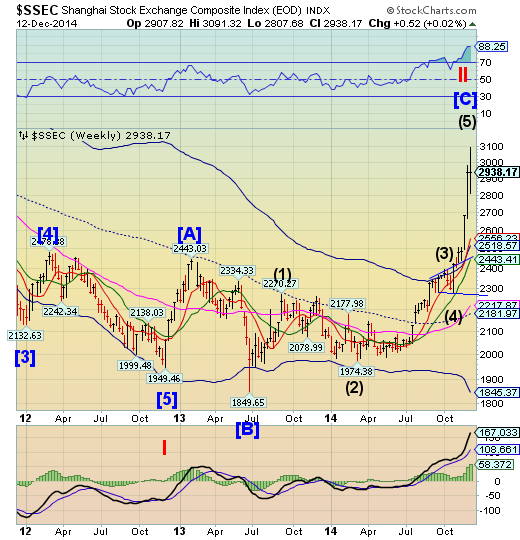
The Shanghai Indexpeaked on Tuesday as suggested last week, but closed the week with a small gain. It did so in a 600-point round trip.The parabola may be over, but they unwind very quickly, so we may expect to see a complete retracement by the next Cycle low near the end of the year.
(Bloomberg) China’s stocks rose, capping a fifth week of gains for the benchmark index, as slowing growth in industrial production boosted speculation the government will take more steps to support the economy.
The Shanghai Composite Index (SHCOMP) advanced 0.4 percent to 2,938.17 at the close, after changing directions at least 10 times. Factory production rose 7.2 percent from a year earlier, the National Bureau of Statistics said, compared with the 7.5 percent median estimate in a Bloomberg News survey
The Banking Index reverses to support.
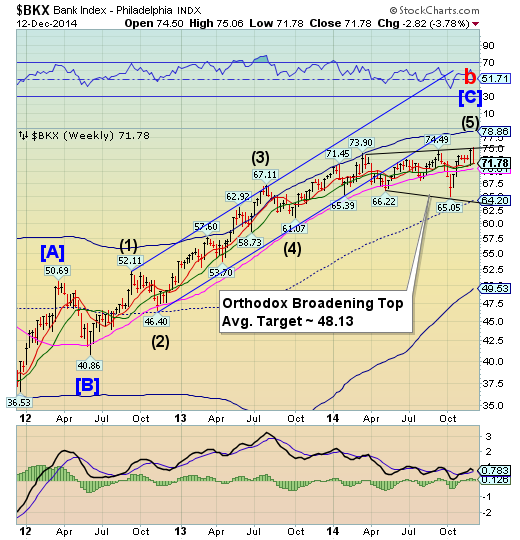
--BKX reversed from the upper trendline of an Orthodox Broadening Top to challenge Intermediate-term support at 71.73.This completes both point 5 of the Broadening Top and Intermediate Wave 5 of the rally from June 4, 2012. The rally took 30.1 months for all the stock indices. BKX now must decline beneath its mid-Cycle support at 64.20 to complete point 6 of the formation.
(Forbes) The ruble is on the skids. It has fallen by more than a third since the summer, largely due to the falling oil price but also in part due to Western sanctions and the general weakness of the Russian economy. The Russian central bank floated the ruble in November and has since allowed it to fall in line with the oil price, though it intervenes now and then to smooth volatility and prevent sharp falls. But it is under pressure to do more to protect the ruble. The falling ruble is causing distress at companies that have debts in foreign currencies. Companies have some $35bn of US dollar-denominated debt obligations to meet in December and a further $98bn in 2015: many of them will struggle to do this as dollars become increasingly expensive.
But the most urgent problem is the dollar liquidity crisis at Russia’s banks. Shut out of financial markets because of Western sanctions, and with the value of ruble-denominated assets falling rapidly, they are struggling to obtain sufficient US dollars to meet foreign-denominated debt payments.
(ZeroHedge) Courtesy of the Cronybus(sic) last minute passage, government was provided a quid-pro-quo $1.1 trillion spending allowance with Wall Street's blessing in exchange for assuring banks that taxpayers would be on the hook for yet another bailout, as a result of the swaps push-out provision, after incorporating explicit Citigroup language that allows financial institutions to trade certain financial derivatives from subsidiaries that are insured by the Federal Deposit Insurance Corp,explicitly putting taxpayers on the hook for losses caused by these contracts.
(ZeroHedge) Funny what a difference two months make. Back on October 4, we wrote "Here We Go Again: Greece Will Be In Default Within 15 Months, S&P Warns" and... nobody cared as the Greek stock market meltup continued. Now, after the biggest three-day rout in Greek stock market history (or about 30% lower), and with the overhyped, oversold, oversusbcribed recent Greek 5 Year bond issue available in the open market some 16 points lower, and suddenly everyone cares. Including Goldman Sachs.
Overnight the bank with the $58 trillion in derivative exposure issued a note "From GRecovery to GRelapse" which is quite absent on the usual optimism, cheerfulness and happy-ending we have grown to expect from the bank whose former employee is in charge of the European printing press. Here is the punchline: "In the event of a severe Greek government clash with international lenders, interruption of liquidity provision to Greek banks by the ECB could potentially even lead to a Cyprus-style prolonged “bank holiday”. And market fears for potential Euro-exit risks could rise at that point."
