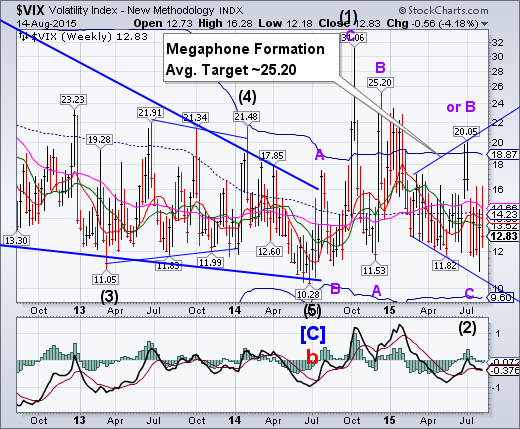
VIX made a new Master Cycle low on August 5. This week it broke (marginally) above its prior high. The next move out of a Broadening Bottom or Megaphone formation is to break out above the upper trendline. Its average target matches that of the Wave A top in mid-December
SPX bounces from the Broadening Wedge trendline
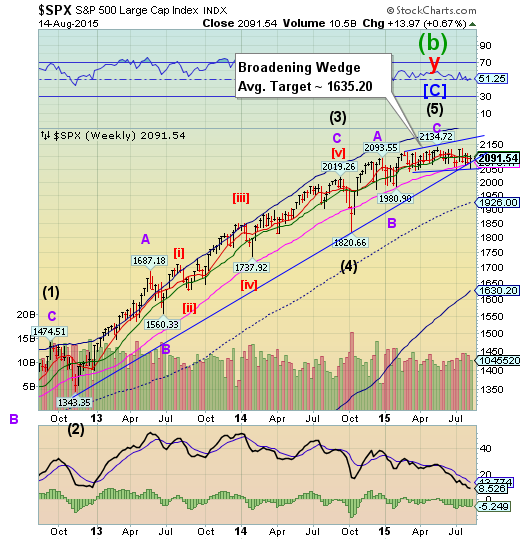
The SPX rallied off its Broadening Wedge trendline, but could not climb above either short-term resistance at 2093.79 or Intermediate-term resistance at 2101.72. The May 20 high at 2134.72 remains the top of this Cycle. The inability to make a new high appears to be extremely bearish. Long-term support and the 3-year trendline have both been violated, which may make next week a game changer.
(ZeroHedge) This week saw the Dow encounter its first "death cross" - when the 50-day moving average crosses below the 200-day moving average - in 4 years. The indicator, often used to signal trend changes (down in this case), has yet to be witnessed in the S&P 500 though, but has been a useful signal at major market turning points in the past (e.g. late 60’s, early 70’s, the dot.com crash and recently the GFC). However, while breadth in this 'market' remains weak by any measure, we note that a stunning 50% of the S&P 500 components are now in the 'death zone'.
NDX violates supports.
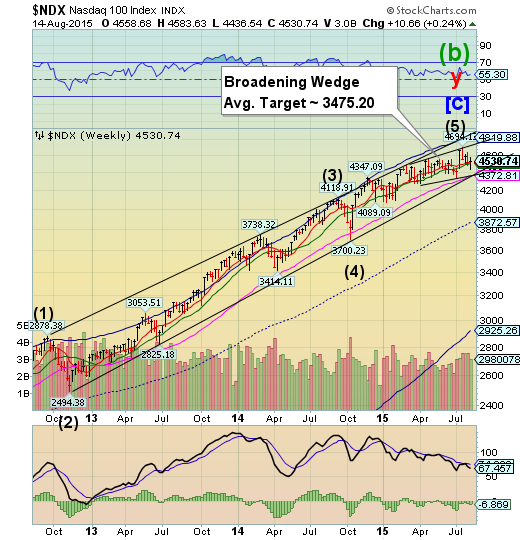
NDX violated weekly Intermediate-term support at 4508.54 before closing above it. A decline to new lows next week puts the Broadening Wedge formation and the three-year trendline in jeopardy. NDX is the investment of choice for retail investors and hedge funds. This week’s move tells us that the bulk of retail investors are still very sanguine about risk.
(ZeroHedge) US corporations watched with detached amusement as Hillary Clinton, in branching out her populist campaign to pander to key Wall Street donor firms such as Blackrock (NYSE:BLK) (where her personal advisor and liaison Cheryl Mills just happens to be a board member), threatened to crack down on stock buybacks. Couple of points: i) by now it is far too late to crack down - most companies, even investment grade ones, are well on their way to being saddled with so much debt the next crisis and/or rate spike will result in a supernova of "fallen angels" and bankruptcies, ii) the government is hopeless to stand in the way of the "other people's money" juggernaut, and if career risk-threatened bond managers demand to hand over cash to management teams who promptly give that money back to shareholders, nothing can stop them.
High Yield Bonds continue to bounce at the Broadening Wedge.
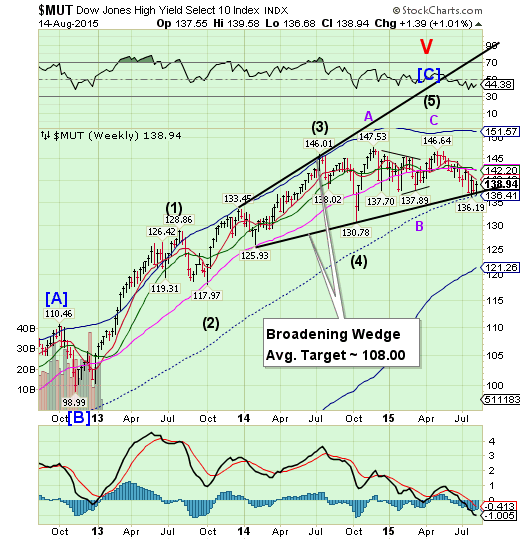
The High Yield Index bounced a second time from the lower trendline of its Broadening Wedge formation and mid-Cycle support at 136.41. It appears that the Master Cycle low was made on July 27, so a bounce was expected. However, it appears that MUT has repeatedly failed to overcome Short-term resistance (now at 140.13), which may indicate a very serious decline straight ahead. The financing of stock buybacks is being seriously threatened by the outflows indicated in the chart.
(CNBC) The biggest trouble sign for stocks may be bonds. High-yield bonds, specifically, often are seen as an effective proxy for movements in the equity market. If that's the case, trends in junk are pointing to a rocky road ahead.
Average yields for low-rated companies have jumped to 7.3 percent and spreads between such debt and comparable duration Treasuries have widened dramatically, according to David Rosenberg, chief economist and strategist at GluskinSheff.
History suggests that fallout in stocks is not far behind.
The euro closes at Short-term resistance.
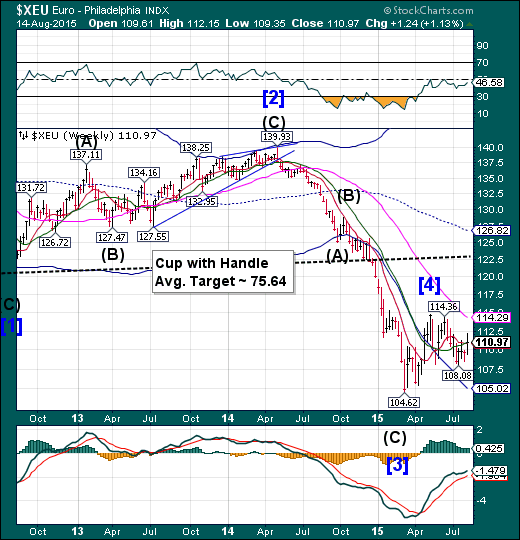
The euro closed the week at Short-term resistance at 110.98. The euro made a Trading Cycle low on July 17. Usually the direction of the cyclical trend is made in the first 30 days. Since it has not made a new high, we may assume that the trend may resume to the downside.
(Reuters) Eurozone finance ministers agreed on Friday to lend Greece up to 86 billion euros ($96 billion) after Greek lawmakers accepted their stiff conditions despite a revolt by supporters of leftist Prime Minister Alexis Tsipras.
Assuming approval by the German and other parliaments, 13 billion euros should be in Athens next Thursday to pay pressing bills, and a further 10 billion will be set aside at the European Stability Mechanism, earmarked to bolster Greek banks' capital.
In all, eurozone governments will lend 26 billion euros in a first tranche of the bailout before reviewing Greece's compliance with their conditions in October.
EuroStoxx may challenge Long-term support next week.
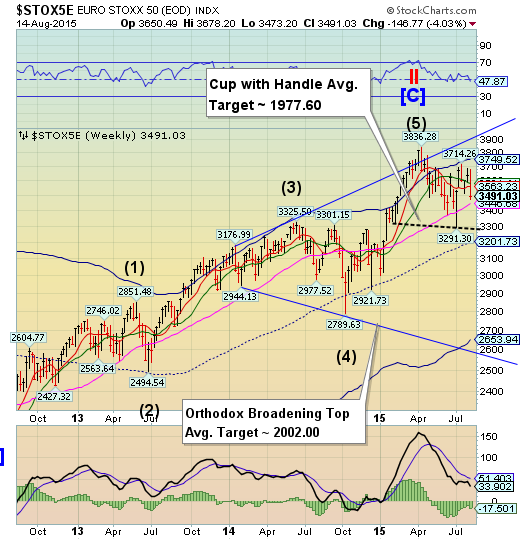
Euro Stoxx 50 fell beneath weekly Intermediate-term support/resistance at 3581.41, closing beneath it at the end of the week. Weekly Long-term support is at 3446.81, providing critical support. The Cycles Model suggests weakness through the end of August. Should Long-term support at 3446.68 be broken this week, a panic decline may result.
(Reuters) - European stocks slipped on Friday to record their worst week in more than a month, in the wake of China's currency devaluation.
The eurozone's blue-chip Euro STOXX 50 index closed down 0.7 percent.
The broader pan-European FTSEurofirst 300 index retreated 0.1 percent to record a loss of 3 percent over the week - its worst weekly performance since early July.
The yen may have seen its low.
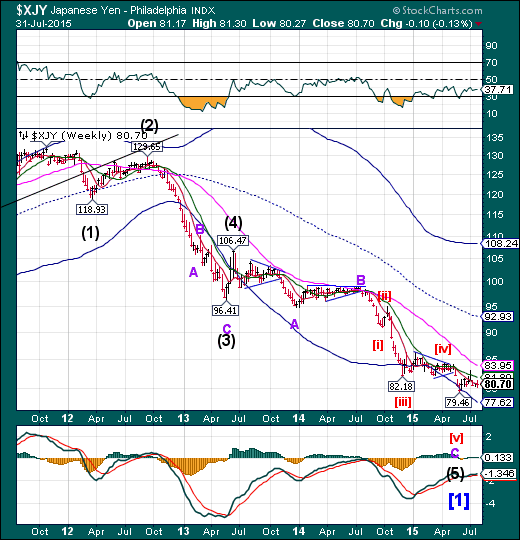
The yen may have seen a Master Cycle low on August 11. Should that low not be surpassed, it may emerge to challenge its Cycle Top at 108.24 through the balance of August and September. However, we need confirmation on the low before any actionable conclusion is made.
(TheStreet) Its been four years since the Fukushima earthquake and that's how long Japan's nuclear power plants have been shuttered. When Prime Minister Shinzo Abe took office in 2012, he vowed to bring the nation's reactors back on line. It's been a long road, but this week, Japan will see the restart of at least one of its 50 or so nuke plants.
One of the consequences of the nuke shutdown was that Japan had to import large quantities of oil, coal and natural gas. This led to a rare and historic trade deficit, which I believe has been one of the main factors in the depreciation of the yen.
(ZeroHedge) In case last week’s deadly chemical explosion in the Chinese port of Tianjin wasn’t enough to satisfy your thirst for black swan-ish disasters that could serve to accelerate the ongoing global currency wars, Japan is now warning that Sakurajima, one of the country’s most active volcanoes, may be set to erupt.
The Nikkei slips under Cycle Top resistance.
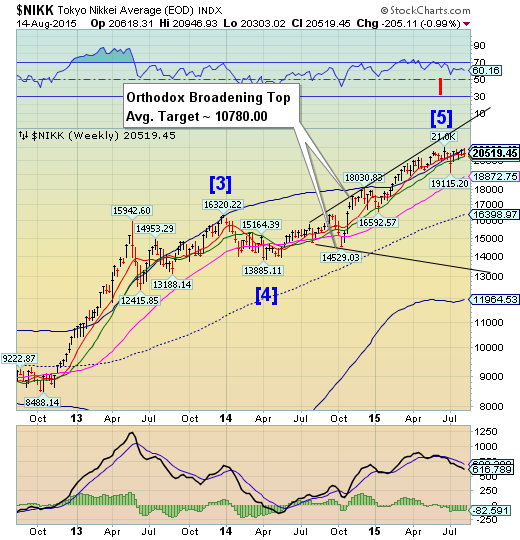
Since the June 24 high, Nikkei slipped under its Cycle Top, currently at 20833.42, and has remained beneath it. The period of strength appears to have ended. A break of Intermediate-term support at 20268.23 may change the trend of the Nikkei in the next two weeks.
(JapanTimes) Stocks lost ground on the Tokyo Stock Exchange on Friday, weighed down by profit-taking ahead of the weekend.
The Nikkei 225 average shed 76.10 points, or 0.37 percent, to end at 20,519.45. On Thursday, the key market gauge surged 202.78 points.
The Topix closed down 3.49 points, or 0.21 percent, at 1,664.46 after rising 2.20 points on Thursday.
The Nikkei opened on a weak note on profit-taking after the previous day’s sharp rebound.
U.S. Dollar tests Model supports.
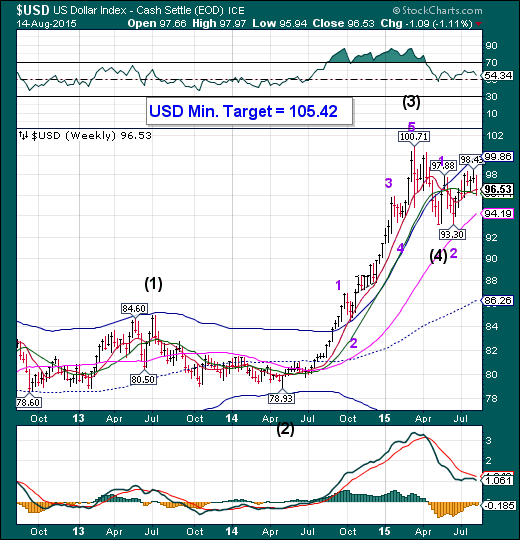
The US dollar tested Intermediate-term support at 96.14 in a minor retracement on Wednesday before closing marginally higher for the week. This is a minor cyclical pullback that continues to test the progress made thus far.The Cycle Models suggest the rally may emerge, pushing the USD higher through early September.
(Reuters) Aug 14 Speculators boosted bullish bets on the U.S. dollar to their highest since the third week of April, according to Reuters calculations and data from the Commodity Futures Trading Commission released on Friday.
The value of the dollar's net long position rose to $37.19 billion in the week ended Aug. 11, from 32.77 billion in the previous week.
USB rallies through resistance.
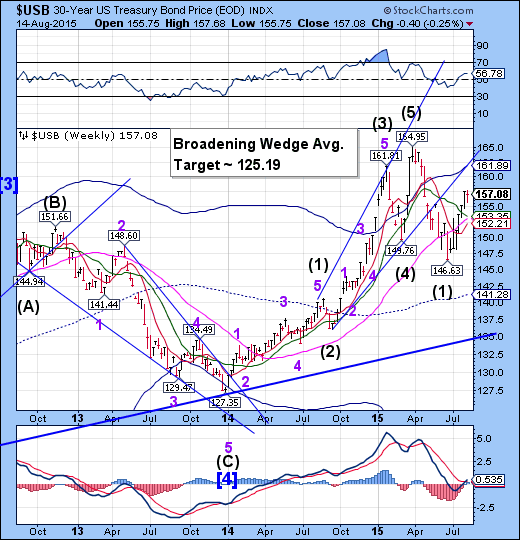
The Long Bond appears to be losing momentum after retracing 60.3% of its decline. This is a potential omen for higher interest rates in the near future. It appears that an important Cycle low is due in the next 2-3 weeks.
(Bloomberg) To get a sense of how robust demand is for U.S. Treasuries, consider that China has reduced its holdings by about $180 billion and the market barely reacted.
Benchmark 10-year yields fell 0.6 percentage point even though the largest foreign holder of U.S. debt pared its stake between March 2014 and May of this year, based on the most recent data available from the Treasury Department. That’s not the doomsday scenario portrayed by those who said the size of the holdings—which peaked at $1.65 trillion in 2014—would leave the U.S. vulnerable to China’s whims.
Gold is trapped under its Cycle Bottom.
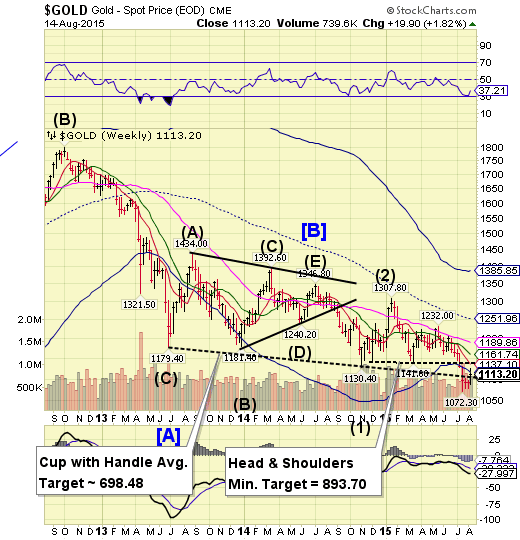
Gold retested challenged its Cycle Bottom at 1118.08, but closed beneath it. The inability to regain Model support is a good indication of an intensified downtrend. This decline may be one for the records.
(ZeroHedge) For the last three weeks, gold has experienced something that has never happened before - hedge funds aggregate net position has been short for the first time in history.
However, as Dana Lyons notes, this week saw another 'historic' shift in gold positioning as commercial hedgers shifted to the least hedged since 2001... so the 'fast' money is chasing momentum and the 'smart' money is lifting hedges into them.
Crude decline accelerates.
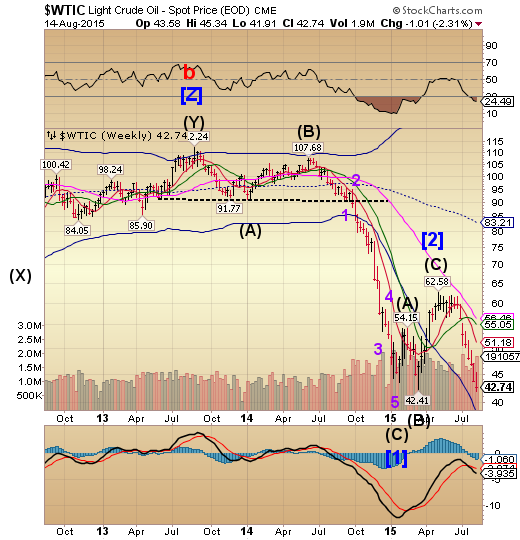
Crude broke below its March low of 42.41 this week, signaling even more downside to come. The decline appears to be capable of lasting through the end of August, according to the Cycles Model.
(ZeroHedge) "Summer is when refineries are all running hard, so actual demand for crude is as good as it gets,” notes Citi's Seth Kleinman, London-based head of energy strategy, but U.S. crude futures have lost 30 percent since the start of June, set for the biggest drop since the West Texas Intermediate crude contract started trading in 1983.
That beats the summer plunges during the global financial crisis of 2008, the Asian economic slump in 1998 and the global supply glut of 1986.
As Bloomberg reports, if crude’s slump back to a six-year low looks bad, it’s even worse when you reflect that summer is supposed to be peak season for oil.
Shanghai Index loses its grip.
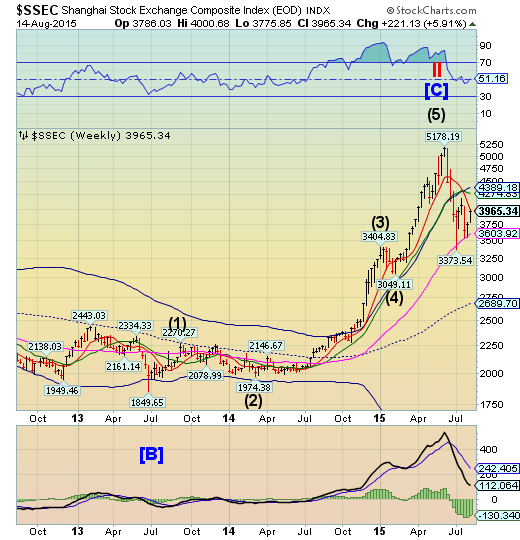
The Shanghai Index extended its bounce off weekly Long-term support, but appears to have been stopped by Short-term resistance at 3984.82. Should Long-term support at 3603.92 be broken, a panic decline may ensue. A potential long-term target may be as low as 1570.00.
(ZeroHedge) Perhaps it’s a case of something getting lost in translation (so to speak), but Chinese authorities have a remarkable propensity for saying absurd things in a very straightforward way as though there were nothing at all odd or amusing about them.
For example, here’s what the CSRC said on Friday about the future for China Securities Finance (aka the plunge protection team):
"For a number of years to come, the China Securities Finance Corp. will not exit (the market)."
The Banking Index challenges its Cycle Top.
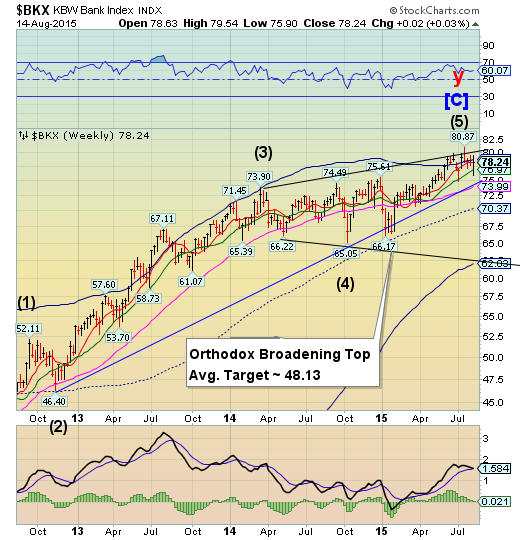
BKX challenged its Cycle Top resistance at 78.70, closing beneath it on Friday. This usually signals a reversal. A loss of Long-term support at 73.99 may confirm the potential change in trend.
(ZeroHedge) The last time former Goldman employee and then Treasury Secretary Hank Paulson bailed out the hedge fund known as Goldman Sachs (NYSE:GS), and its closest peers (but not its biggest fixed income competitor Lehman Brothers of course), even the traditionally confused American public pushed back on the structure of the bailout that converted the Goldman holding company into an FDIC-insured company, which led many to ask: just where are Goldman's deposits?
The answer, of course, was nowhere, so perhaps in anticipation of the logical pushback against its second, upcoming bailout, which would see the taxpayer-backed depositor insurance company once again provide trillions in cash to banks as well as the glorified hedge funds such as Goldman, the firm moments ago decided to do something it has never done before: become an actual bank with checking accounts and such.
(ZeroHedge) After China's shocking currency devaluation, which some more conspiratorially-minded observers have concluded was China's retaliation to the west for the IMF's recent snub that pushed back China's evaluation for inclusion into the SDR to some indefinite point in 2016, the only question on everyone's mind is whether the Fed will delay or outright cancel any imminent "data-dependent" rate hikes as a result of the implicit tightening of monetary conditions thanks to China, and the dramatic appreciation of the USD that would not have taken place without China.
(ZeroHedge) One year ago, as part of its always entertaining long-run forecasting exercise, Bank of America (NYSE:BAC) predicted that GDP growth in 2015 and 2016 would be 3.3% and 3.4% respectively.
Fast forward one year, when in its updated "long-run" forecast, Bank of America's crack economist Ethan Harris admits he was off by "only" 30% in his prediction of next year's GDP, and instead of 3.3%, he now "forecasts" 2015 GDP to be... 2.3%.
Not only that, but BofA has now also taken down all over its medium-term GDP forecasts lower by 0.4% and its terminal growth rate is now down 10% from 2.2% to 2.0%. Expect next year to see the first sub 2% potential growth rate of the US.
