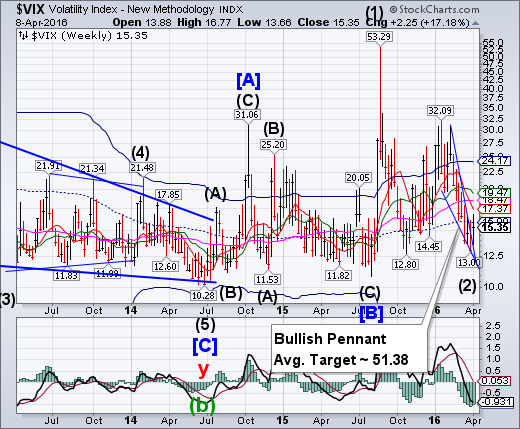
VIX appears to have completed its Wave (2) low and emerged above its Pennant formation. It also challenged mid-Cycle resistance at 15.90, giving an aggressive buy signal (NYSE sell signal). Two different opinions are expressed below.
(Bloomberg) Betting that the stock market will get more volatile has been one of the worst trades amid a 13 percent rebound in U.S. stocks. It was also one of the most popular, with a record $2 billion added in the last six weeks to exchange-traded products that benefit from a rise in the Chicago Board Options Exchange Volatility Index, the gauge known as the VIX.
(ZeroHedge) Volatility (VIX) is now at its lowest level since before the August sell-off last summer yet CS Fear Barometer remains elevated leaving the spread between the two options-market-based indicators is at its widest ever.
SPX closes beneath the 4.5-year trendline.
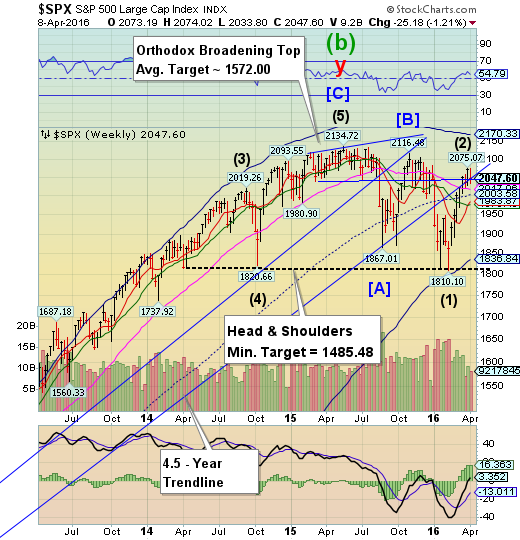
The SPX rallied above the 4.5-year trendline at 2055.00, making its high on April 1. This week it has closed beneath it. Trendlines are important support areas that often attract, then repel the markets. Earnings season kicks into high gear next week. SPX average earnings are expected to decline another 7.4% year-over-year in the first quarter after a 7% decline in the fourth quarter.
(Bloomberg) It’s official -- the rally in U.S. stocks that erased the worst-ever start to a year has fizzled, with the biggest weekly slide since February depriving the bull market of momentum ahead of what’s forecast to be the steepest earnings slump since the financial crisis.
The Standard & Poor’s 500 Index fell 1.2 percent in the five days to 2,047.60, the second slide in the three weeks since the gauge erased an 11 percent loss for the year. The period was tumultuous, with the average daily swing of 0.8 percent the most in a month, while three days of 1 percent moves ended a 15-day stretch of calm, the longest since March 2015. The Chicago Board Options Exchange Volatility Index capped its biggest weekly advance since January.
Also read, ZeroHedge’s “How Much Of S&P Earnings Growth Comes From Buybacks”
NDX may have reversed course.
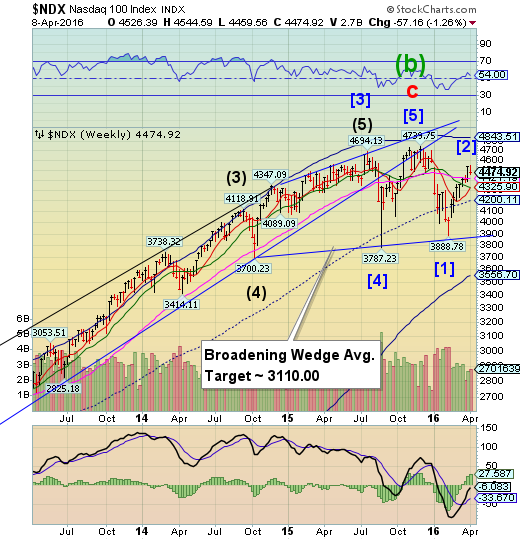
NDX made its high on Monday, but quickly reversed course.Long-term support is at 4421.19. Should it decline beneath that level, NDX maybe on a sell signal.
(CNBC) U.S. stocks closed well off session highs Friday, despite a rally in oil, as the yen strengthened against the U.S. dollar.
The major averages declined more than 1 percent for the week, the worst since Feb. 5 for S&P 500 and Nasdaq composite and the worst since Feb. 12 for the Dow Jones industrial average.
The S&P 500 clung to year-to-date gains in the close after briefly erasing them as the major averages temporarily turned lower in afternoon trade. The Dow Jones industrial average closed 35 points higher after earlier adding 152 points.
High Yield Bond Index makes a new high.
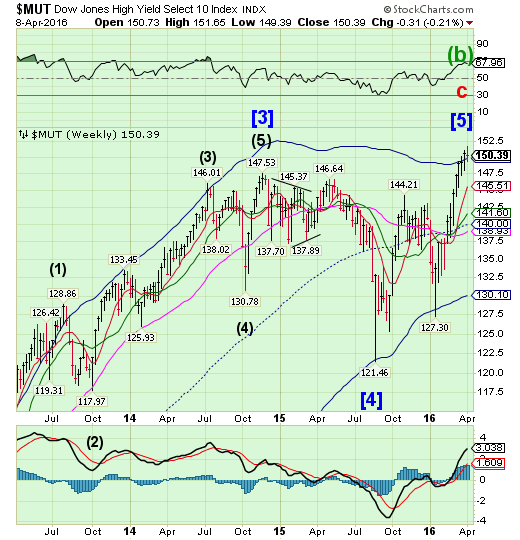
The High Yield Index may have made its final high on Wednesday. This may mark the end of an era for high yield bonds.But we won’t get any cautionary notes from the media and their analysts. See below.
(YahooFinance) Investor flows into high yield bond funds
Investor flows into high yield bond funds were negative last week after six consecutive weeks of inflows. According to Lipper, net outflows from high yield bond funds totaled $545 million in the week ended March 30, 2016, the second-lowest outflows year-to-date (or YTD).
In the previous week, high yield bond funds saw net inflows of $2.2 billion. Even with outflows last week, high yield bond funds witnessed YTD inflows of $7.7 billion.
The euro rally is running out of time.
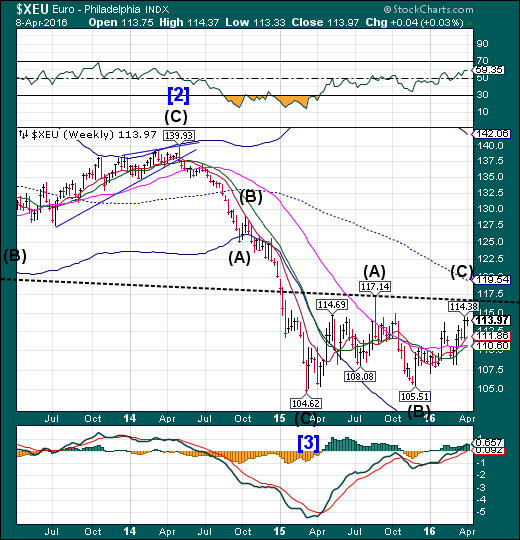
The euro rally appears to be running out of time without reaching its upside objective. The Cycles Model suggests the euro may put in an important low in the next two weeks. An untoward event may push the decline deeper than one would expect..
(WSJ) For the European Central Bank, old habits die hard.
The ECB says it doesn’t target the exchange rate. But bank officials have a habit of stepping up to talk the euro down whenever it rises too far.
Investors often see around the $1.15 mark as a level that sends the eurozone’s central bankers to the microphones.
That happened again on Thursday. The euro climbed as high as $1.1456 in early European trade before two senior ECB officials made speeches underlining the bank’s readiness to provide fresh monetary easing if needed.
EuroStoxx challenges 3000, then sells off .
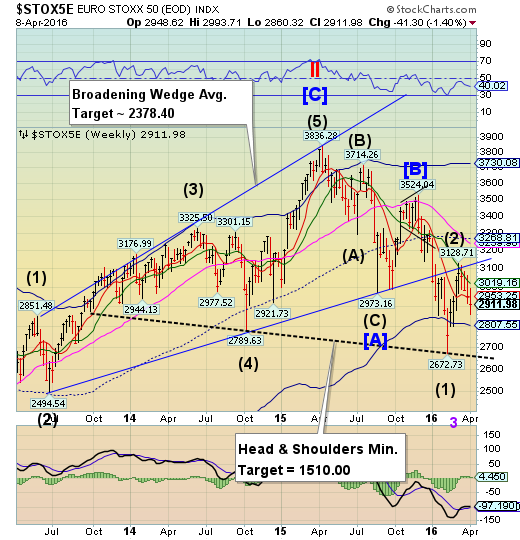
EuroStoxx fell below 3000.00 last week, but was obliged to do a retest before furthering its decline. In doing so, it also crossed beneath Short-term support at 2953.25, confirming its sell signal. The Head & Shoulders neckline defines the potential magnitude of the decline.
(CNBC) .European markets closed higher Friday with investors reacting to price volatility in commodity markets and positive trade data from Germany.
The pan-European STOXX 600 closed higher by 1.1 percent provisionally, down 0.4 percent for the week, with oil and gas stocks outperforming the wider benchmarks. Brent crude futures were up over 5 percent while U.S. crude futures were over 6 percent higher at Europe's close. This came on the fresh hopes over a proposed freeze in oil production.
"Yet again it's the price of oil that's driving the bulk of (the) rally," Tony Cross, a market analyst at Trustnet Direct, said in an afternoon note.
The yen is ramping higher.
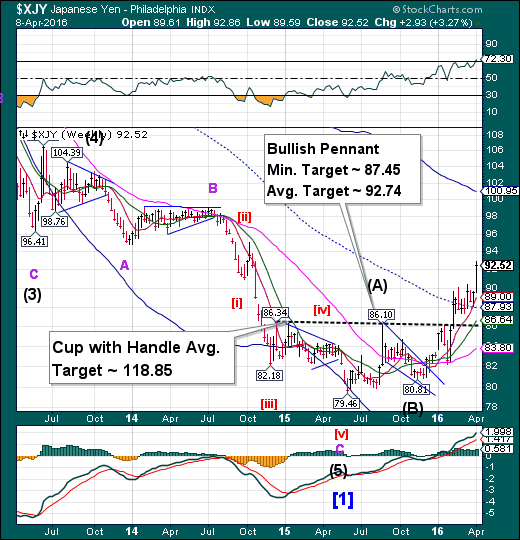
The yen has achieved its Bullish Pennant targets. The interesting thing is that the yen may go even higher. The Cycles Model doesn’t give a potential turn date until mid-April. While the Cup-with-Handle target may seem farfetched, the Cycle Top at 100.95 may be attainable should the rally continue.
(TheGuardian) Fears that Japan’s anti-deflation strategy is unravelling have intensified after a sharp rise in the value of the yen against the dollar prompted a concerted attempt by policymakers in Tokyo to talk down the value of the currency.
Japan’s finance minister, Taro Aso, raised the prospect of intervention on the foreign exchanges to counter what he called the “excessive” rise in the yen, which has gained 12% against the dollar since the start of 2016 to stand at a 16-year-high.
Also read Bloomberg’s “The Yen's Puzzling Surge, Explained in One Morgan Stanley Theory”
The Nikkei approaches the Head & Shoulders neckline.
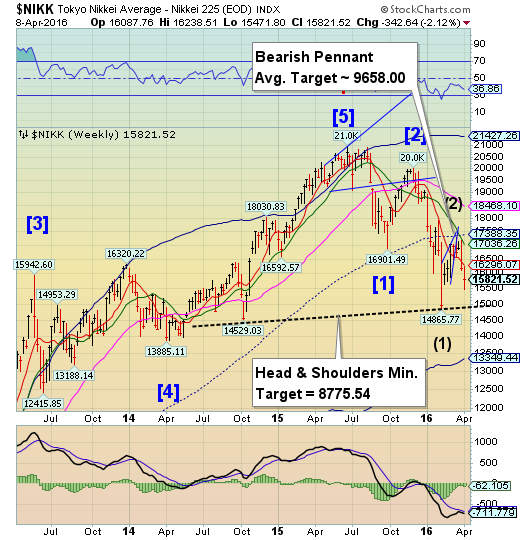
The Nikkei continued its decline with a small bounce on Friday. The Head & Shoulders neckline is at approximately 14900.00. Crossing the neckline may be instructive regarding its ultimate target. Should that occur, the next support lies at the Cycle Bottom at 13349.44.
(Reuters) Japan's Nikkei rose on Friday afternoon in volatile trade, reversing its course as the dollar firmed against the yen and lifted risk appetite, but a sharp drop on Fast Retailing limited gains on the benchmark.
The Nikkei share average gained 0.8 percent to 15,874.76 in midafternoon trade, crawling back from its intraday low of 15,471.80.
Japanese Finance Minister Taro Aso said early on Friday that rapid foreign exchange moves were "undesirable," that the current yen moves were "one-sided," and that Japan would take steps as needed. Aso's words helped the dollar gain about 0.4 percent to 108.67 yen.
U.S. dollar makes new lows.
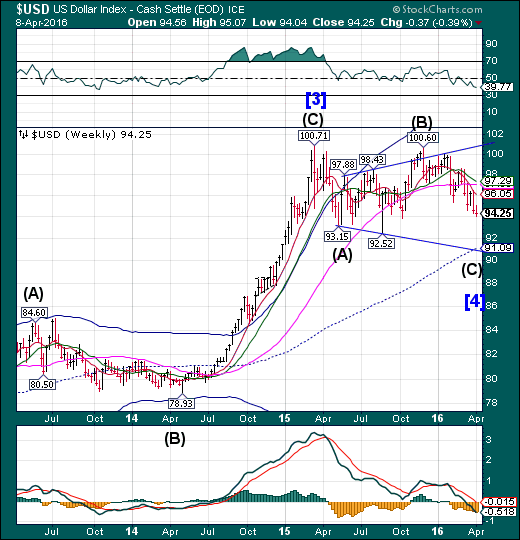
USD made a new low, nearly achieving a short-term target of 93.93. The Cycles Model suggests a short-term bounce is due, but the longer-term decline may not be over, perhaps lasting through mid-May. Now that traders have turned bearish, the dollar may bounce for the next week or longer. The ultimate target for USD may be the weekly mid-Cycle support at 91.09.
(Reuters) Speculators further chopped bullish bets on the U.S. dollar for a fifth straight week, pushing net longs to their lowest in more than two years, according to Reuters calculations and data from the Commodity Futures Trading Commission released on Friday.
The value of the dollar's net long position fell to $2.15 billion in the week ended April 5, from $4.65 billion the previous week. Dollar net longs came in below $5 billion for a second consecutive week.
USB rallies impulsively, yields near February “flash crash” lows.
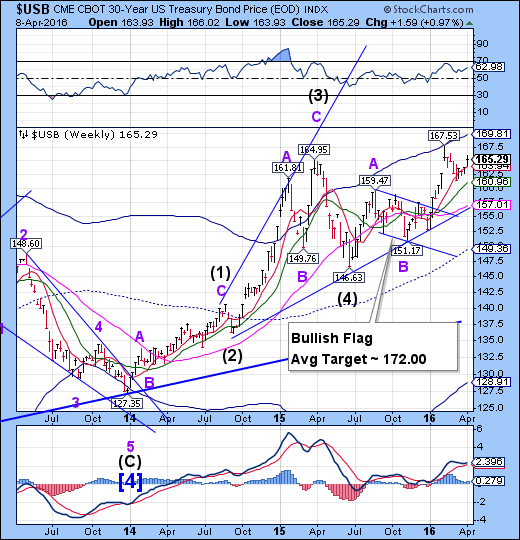
The Long Bond is finally advancing impulsively, after several weeks of delays. USB appears to be due for its all-time high in the next two weeks. Bonds have not been this overpriced (historically lowest yields) in over 300 years.
(ZeroHedge) Three weeks ago, when the Fed and Janet Yellen shocked markets with their extremely dovish statement in which they admitted the US Federal Reserve no longer is US data dependent, and instead is far more focused on global developments and especially China's dollar-pegged currency (which makes it impossible for the Fed to be hawkish without causing further FX instability and leading to more Chinese capital flight), CNBC's Steve Liesman asked Yellen point blank a question which would seem otherwise completely taboo: does the Fed have a credibility problem.
(ZeroHedge) It appears the search for a safe-haven has left Biotechs and FANGs as investors' flight to quality sparks a bid under bonds and bullion. US Treasury yields are tumbling with 10Y and 30Y near the low close from mid-February's "flash-crash" lows.
Gold declines to mid-Cycle support, bounces.
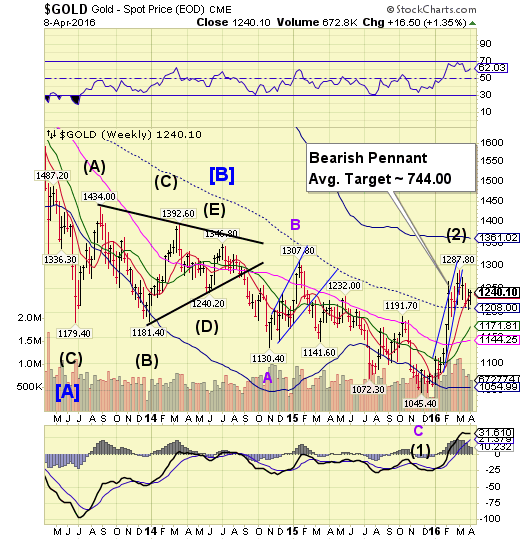
Gold bounced off weekly mid-cycle support at 1208.00 to challenge Short-term resistance at 1237.38. A decline from this spot would constitute a sell signal. Should it slip beneath mid-cycle support, it may likely challenge Long-term support at 1144.25. Investors are still treating gold as a buy-the-dip opportunity..
(CNBC) The GLD (NYSE:GLD), the ETF that tracks gold, has been on a tear — up 17 percent this year. And according to one savvy trader, the precious metal's run is far from over.
On Thursday, when bullish trades outpaced bearish ones, a trader bet more than $2 million that the gold could rally 10 percent in one month.
The trader purchased 10,000 July 125-strike calls for $2.29. Since each call option accounts for 100 shares, this a $2 million bet that the GLD will rise above $127.30 by July expiration.
Crude retraces its decline.
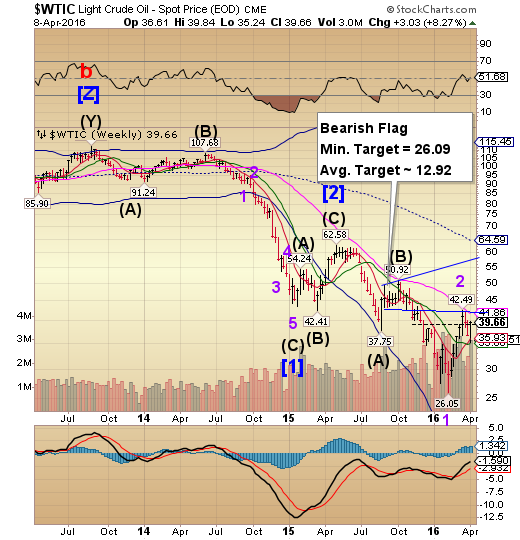
Crude made a 64% retracement of the decline from its March 18 high at 42.49. The bounce stopped near a secondary support/resistance level at 38.50. A further decline from that level suggests the sell-off may be underway. Weakness may extend through mid-April, with Cycle Bottom Support continuing to fall away at 13.74,lending support to the average target analysis of the Bearish Flag. Analysts won’t be calling for a bottom when it finally arrives.
(WSJ) Oil prices surged to one of their strongest performances of the year as signs that oversupply may wane and the global economy may improve keep encouraging traders to bet on an oil rebound.
Oil prices jumped 8% on the week, their best week in a month, largely from Friday’s rally. For U.S. oil, it was the 12th session in a little more than two months that prices climbed about 5% or more. The market has become prone to large swings upward with many traders eager to bet a big recovery is on the way after 20 months of steady losses sent oil to a 13-year-low in February.
Shanghai Index falls back below mid-Cycle resistance.
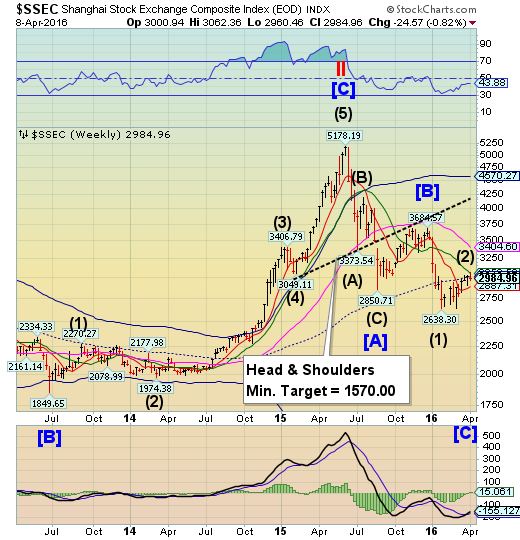
The Shanghai Index challenged its weekly Intermediate-term resistance at 3052.50 before falling beneath mid-Cycle resistance at 3010.37. This kind of action portends a potential reversal-in-the-making. A decline beneath Short-term support at 2887.37 may confirm a sell signal in the Shanghai.
(ZeroHedge) It was just a few days ago when we covered most recently that China has created a subprime debt bubble of monstrous proportions. We explained that the exposure isn’t just within the conventional, state-backed banking system, but also within their "wild west" shadow banking system, which has introduced "investors" to a significant amount of risk.
We know that it’s not a question of if, but when will the bubble finally pop (and as we show below, it already has) and introduce a new subprime (and debt in general) financial crisis for the world to deal with.
While it is sometimes difficult to get the data around just how significant a problem NPL defaults have become for China, and more specifically how the shadow banking lenders are faring, Bank of America (NYSE:BAC) has done some work to help give clarity around just that.
The Banking Index loses Cycle Bottom support, may free-fall.
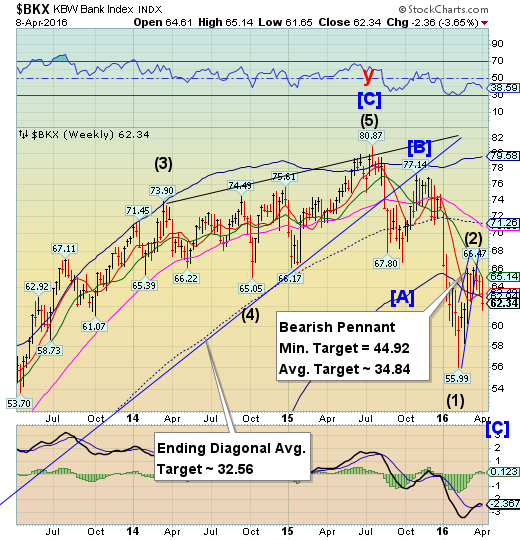
BKX fell beneath its Cycle Bottom support at 62.94, leaving it in a free-fall zone. The minimum target may be the first Bearish Pennant target at 44.92. There may be at least another week of decline before a Cycle low is attained.
(RollingStone) Paul Krugman wrote an op-ed in the New York Times today called "Sanders Over the Edge." He's been doing a lot of shovel work for the Hillary Clinton campaign lately, which is his right of course. The piece eventually devolves into a criticism of the character of Bernie Sanders, but it's his take on the causes of the '08 crash that really raises an eyebrow.
By way of making a criticism of the oft-repeated Sanders charge that the big banks need to be broken up, Krugman argues that banks were not "at the heart of the crisis."
This is Krugman's assessment of who was responsible:
"Predatory lending was largely carried out by smaller, non-Wall Street institutions like Countrywide Financial; the crisis itself was centered not on big banks but on 'shadow banks' like Lehman Brothers that weren't necessarily that big."
(Yahoo!Finance) Thanks, but no thanks.
That was the response of small banks after Jamie Dimon called for a truce this week between large and small lenders. The JPMorgan Chase & Co (NYSE:JPM). chief executive officer said the industry needs to work together, particularly in Washington, to achieve its policy goals with Congress and regulators.
“Just because Jamie Dimon says ‘let’s sing kumbaya’ doesn’t mean community banks are going to just line-up like a Greek chorus," said Camden Fine, president of the Independent Community Bankers of America, a lobbying group for small banks. “This is just an attempt to link the interests of mega banks to community banks in order to mitigate the political heat that is on them right now. CEO’s of all the too-big-to-fail banks are clearly worried about the political climate."
(WSJ) Banks hoping to lower the burden of new capital rules are turning to the fine print.
Specifically, they are turning to the 79th page of a 2013 document titled “Regulatory Capital Rules”and looking at footnote 151. That reference effectively lets banks hold less capital against shorter-term derivatives, and banks want to harness it to lessen the blow when they enter into longer-running contracts.
"(ZeroHedge) As of this moment, various European banks but most prominently Deutsche Bank (DE:DBKGn)...
... as well as Credit Suisse (SIX:CSGN) and RBS (LON:RBS), have been crashing back to lows hit in early February and then all the way back to the March 2009 "the world is ending" lows. We commented on this yesterday using, ironically enough, a note by Deutsche Bank strategist Jim Reid, in which we showed all the things that were not supposed to happen when Draghi unleashed his massive quad-bazooka QE expansion.
