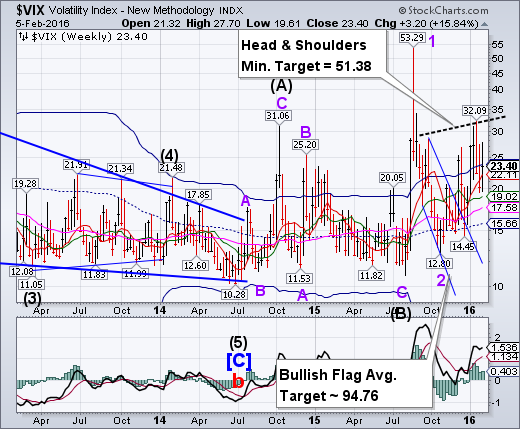
VIX rose above all near-term resistance except the Cycle Top at 23.75. Most market watchers would not take alarm until the VIX exceeds 25.00. However, the buy signal (NYSE sell signal) is confirmed. The close above the neckline suggests a very robust follow-through rally in the following week. Traders are still sanguine after the market sell-off following the jobs report.
SPX reversed course.
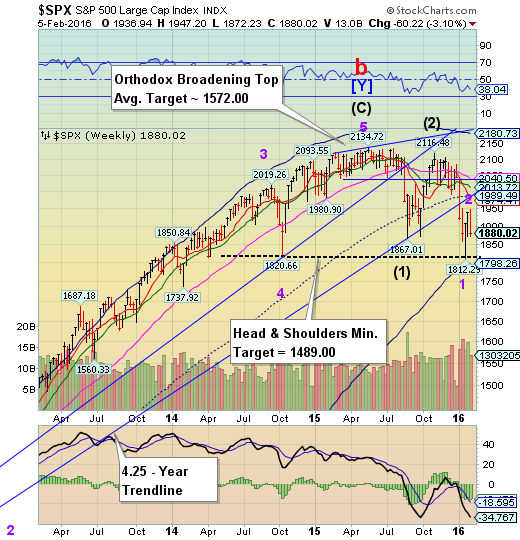
The SPX managed a slightly higher retracement on Monday before selling off. It did not break beneath its Wednesday morning low, keeping many investors looking for another rebound. However, corporate pension contributions appear to have run their course and the Cycles Model indicates weakness may prevail over the next week. If so, the neckline awaits the next downdraft, which may come faster than expected.
(Reuters) Global stock markets slumped and the U.S. dollar rallied on Friday after a key U.S. jobs report painted a mixed picture of the labor market and left investors with a muddled view on interest rate hike prospects.
Oil prices dipped, ending the week lower after two weeks of gains.
Wall Street ended lower, led by plunging technology shares after poor results from data company Tableau Software (N:DATA) and networking platform LinkedIn (N:LNKD). The S&P 500 information technology sector fell 3.4 percent, while the Nasdaq Composite Index slumped to its lowest close since October 2014.
NDX declines to a Head & Shoulders neckline.
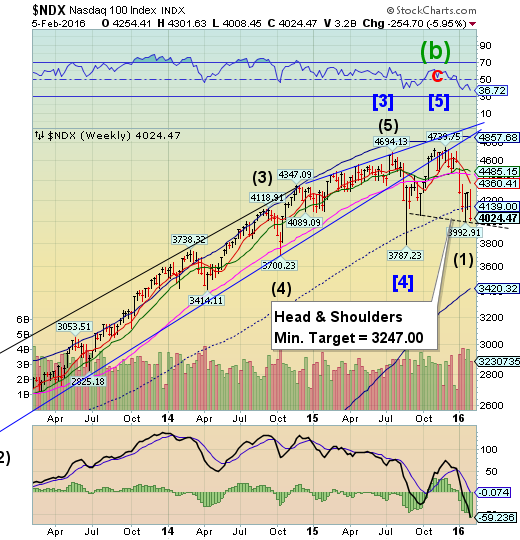
NDX also completed its retracement rally on Monday and sold off during the rest of the week. It halted just above the Head & Shoulders neckline at 3992.91. There is nothing bullish about this action. Should panic develop, NDX may decline well beneath 3000..
(WSJ) The S&P 500 posted its biggest weekly decline since the start of the year, with technology shares suffering particularly sharp losses.
Investors shied away from risky assets amid soft economic data. Stocks fell and the dollar strengthened on Friday after a U.S. Labor Department report showed job growth slowed in January after a surge at the end of last year.
“It’s not good because we’re not having the job growth...we want,” said Peter Costa, president of brokerage Empire Executions. “That word ‘recession’ is starting to pop up in conversation.”
Stocks fell to session lows in afternoon trade, highlighting how volatility continues to be a markets fixture this year amid persistent concerns over tepid economic growth.
High Yield Bond Index may have been saved by a rally in the oil patch.
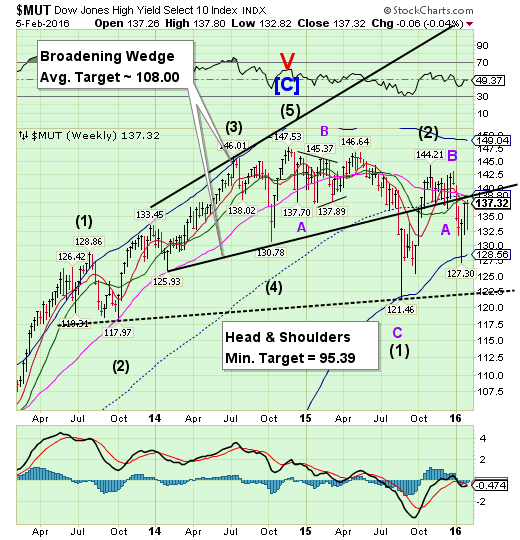
The High Yield Index may have had losses curbed by strength in the price of crude oil. This resulted in only a marginal loss despite large swings in the index. Nonetheless, it may be ready for an imminent reversal to challenge the neckline of the Head & Shoulders formation near 122.50. MUT remains on a sell signal.
The euro breaks above its consolidation zone.
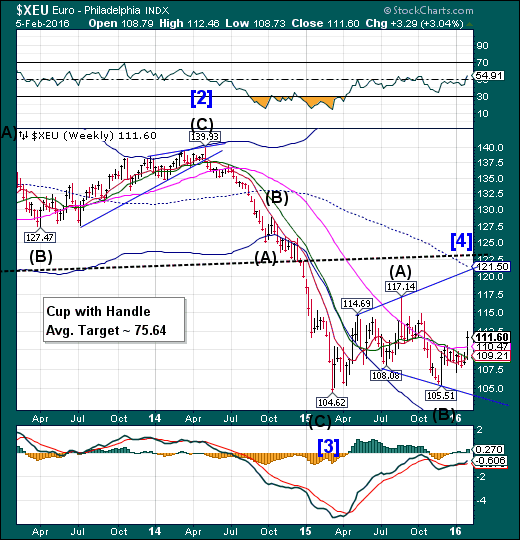
The euro broke above its consolidation zone to new highs not seen since last October. The minimum target for this breakout appears to be 117.14, last seen in late August. This appears to be a take-no-prisoners short squeeze that may ramp very quickly.
(ZeroHedge) It was just two days ago that Bloomberg implored officials to “bring on a cashless future” in an Op-Ed that calls notes and coins “dirty, dangerous, unwieldy, and expensive.”
You probably never thought of your cash that way, but increasingly, authorities and the powers that be seem determined to lay the groundwork for the abolition of what Bloomberg calls “antiquated” physical money.
We’ve documented the cash ban calls on a number of occasions including, most recently, those that emanated from DNB, Norway’s largest bank where executive Trond Bentestuen said that although “there is approximately 50 billion kroner in circulation, the Norges Bank can only account for 40 percent of its use.”
EuroStoxx challenges the Head & Shoulders neckline.
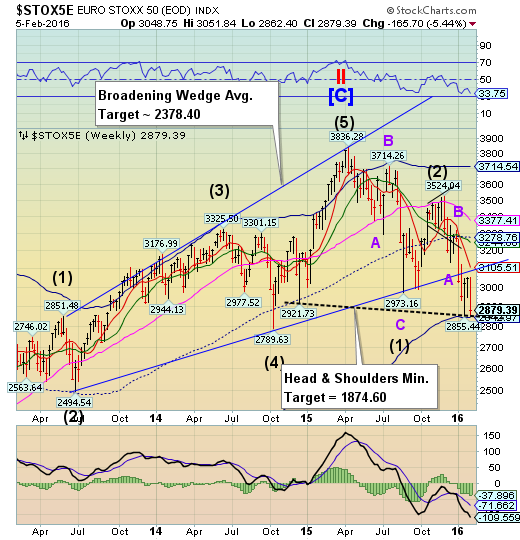
EuroStoxx stopped short of violating its Head & Shoulders neckline at 2855.44. However, there was no bounce. The decline may continue beneath the neckline and Cycle Bottom support next week. The Cycles Model suggests a panic decline may develop.
(CNBC) European markets finished lower on Friday after the latest U.S. jobs data showed a slowdown in employment in January.
The pan-European STOXX 600 ended around 0.9 percent lower, with all major bourses in negative territory as investors digested weaker-than-expected U.S. employment data.
The yen challenges a Cup-with-Handle formation.
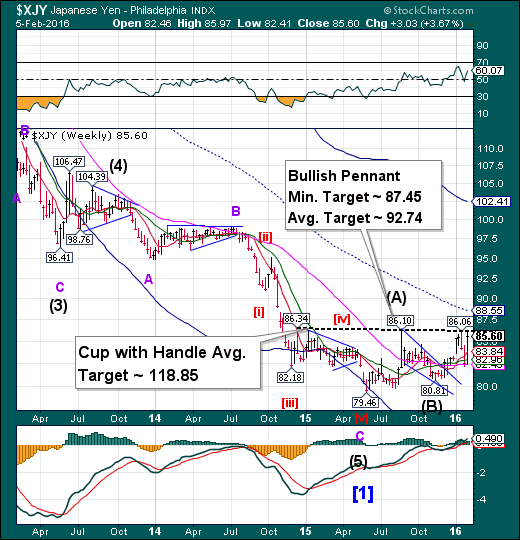
The yen rallied to the Lip of its Cup with Handle formation, but did not break through. The immediate implication of a breakout is a probable rise to an average near 92.50 or higher. The yen just completed a Master cycle low, which allows the rally to resume in strength into mid-February, or longer. The (short-term) pennant target may come in a matter of weeks, while the Cup with Handle target may take months.
(Bloomberg) The yen is set for its biggest weekly advance against the dollar in more than six years amid concern global economic growth is slowing as traders cut bets on whether the U.S. will raise interest rates this year, overshadowing the impact of Japan adopting negative rates.
The Japanese currency has more than recouped the tumble triggered when the Bank of Japan last week unexpectedly decided to charge lenders for some of their excess reserves held at the central bank. Prospects for higher interest rates in the U.S. are receding on speculation the Federal Reserve can’t tighten monetary policy further against a backdrop of global turmoil. The euro is heading for its biggest weekly advance since 2011 even as the European Central Bank reviews its monetary stance.
The Nikkei completes its retracement, begins another decline.
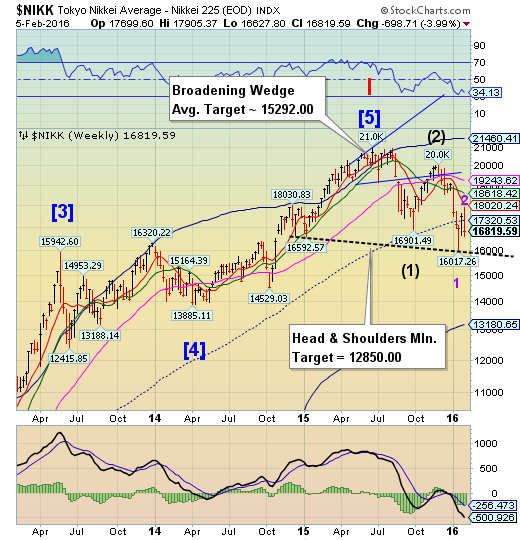
The Nikkei topped off its retracement beneath weekly Short-term resistance at 18020.24 on Monday, then reversed course. It overcame the mid-Cycle support at 17320.53. The sell signal has been reinstated with the final support to overcome at the Head & Shoulders neckline. Weakness may intensify next week.
U.S. dollar breaks down.
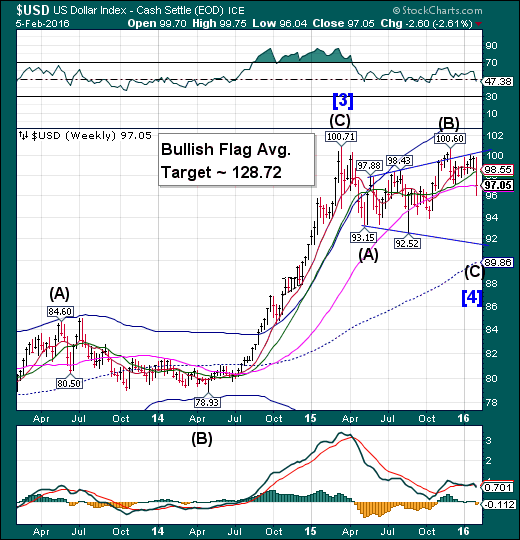
After a failed rally last week the US dollar fell beneath weekly Long-term support at 97.02, closing the week just above it. The Cycles Model calls for a fast decline, possibly falling as far as the lower trendline of the Broadening formation. Bullish speculators have been caught the wrong way in their positions, causing a panic among the longs as this decline has the potential of wiping out all 2015 gains.
(AFR) The United States dollar is still king in the global financial system.
China may generate more headlines with a 2 per cent devaluation but while the world was watching Beijing last year, the US dollar staged an incredible bull run.
All of a sudden that's over. And as the US dollar took a pummeling this week, other currencies and other markets responded violently, proving once again the central place of the greenback.
The key to understanding what's happening in global markets is to understand what's happening to the US dollar. And the key to that is to know what's happening to the US economy. The greenback is on the cusp of a correction because currency traders have become convinced by what the rates market has been thinking for a long time: the Federal Reserve will struggle to raise interests this year. As 2016 gathers pace, the optimistic view the US Fed took on the economy only last December suddenly looks overconfident
USB extends its rally.
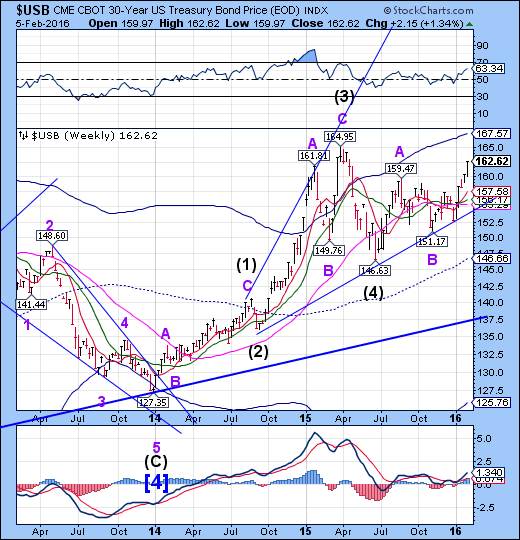
The Long Bond continued to gain strength in its uptrend as Treasury shorts are being squeezed. USB appears to be capable of attaining Cycle Top resistance currently at 167.57 in the next two weeks. After that, we’ll be looking for the 34.4-year high in Treasuries.
(CNNMoney) Good news if you still haven't refinanced your mortgage. The 10-year Treasury yield is hovering near its lowest levels since April of last year.
But that's not necessarily a great sign for the stock market or broader economy.
The benchmark 10-year Treasury is now just 1.82%. It was 2.33% as recently as late December -- shortly after the Federal Reserve raised short-term rates for the first time in nine years.
What's going on? Bond yields -- stop us if you've heard this Fixed Income 101 spiel before -- fall as bond prices rise. In other words, when people buy bonds, rates go down.
And people have been buying boatloads of bonds this year because they're scared out of their minds as oil prices collapse and China's economy slows down.
Gold surges in a probable throw-over.
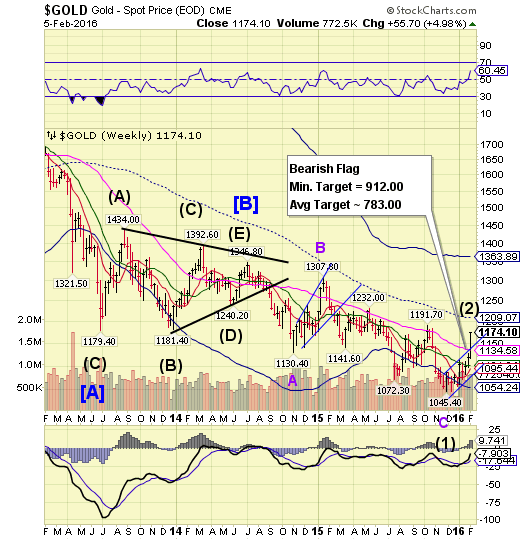
Gold rallied beyond Long-term support/resistance at 1134.10 in a throw-over of an Ending Diagonal. It appears that gold had a delayed, inverted Trading Cycle high as of this week. A decline beneath Long Term support may signal a change in trend.
(Reuters) Gold rose to a three-month high in volatile trade on Friday, as a mixed U.S. jobs report prompted investors to reassess the outlook for U.S. interest rates this year, putting bullion on track for its strongest weekly performance in more than a year.
U.S. employment gains slowed more than expected in January as the boost to hiring from unseasonably mild weather faded, but rising wages and an unemployment rate at an eight-year low suggested the labor market recovery remains firm.
"The futures curve is showing that the probability of a March (rate) hike has fallen to around 10 percent, around the lowest levels last seen in October, but there is a greater than 50 percent probability there will be an additional hike this year," said Suki Cooper, precious metals analyst for Standard Chartered (L:STAN) Bank in New York.
"This has buoyed the risk-off sentiment that has boosted gold prices."
Crude had a wild week.
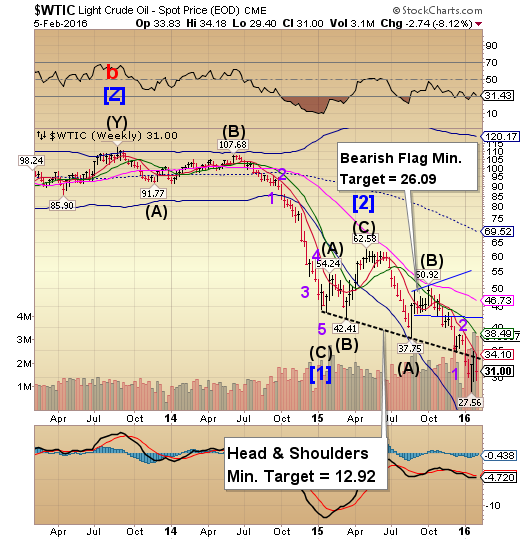
Crude bounced below the Head &Shoulders neckline and weekly short-term resistance at 34.10. The rally came as a large hedge fund unloaded its short positions. The aftermath has created wide price swings bearing almost no relationship to the news. Crude appears to resume the decline, with Cycle Bottom Support continuing to fall away at 18.88, supporting this view.
(CNBC) Oil prices ended the week lower in choppy trading on Friday, snapping two weeks of gains, as a frenzy of speculation about a possible deal between top oil producers clashed with concerns about a growing supply glut.
After a volatile week's trading, much is riding on Sunday's meeting between Venezuelan Oil Minister Eulogio Del Pino and his Saudi counterpart Ali al-Naimi in Riyadh, after Del Pino's discussions with the Qatari and Omani ministers this week.
Shanghai Index bounces for the holiday.
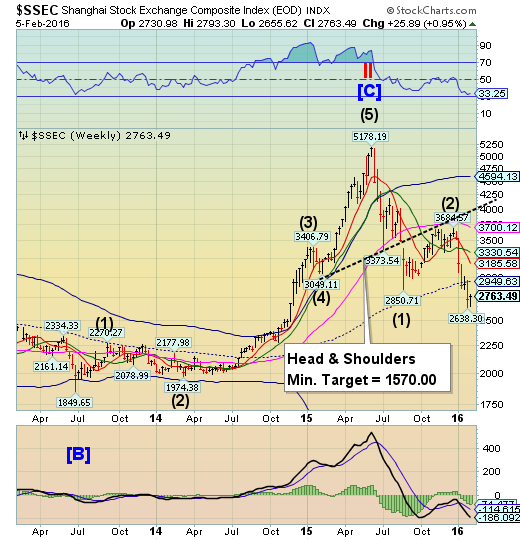
The Shanghai Index bounced this week as the Peoples Bank of China (PBOC) pulled out all the stops to prevent the yuan devaluation and capital leaving the country. This weekend starts the week-long Chinese Spring Festival and Monday begins the Chinese New Year. The Chinese markets remain closed for the duration.
(ZeroHedge) In early December, Ding Ning and his girlfriend Zhang Min were planning to make a run for it.
The couple had come to the end of the road with the massive fraud they were running through P2P lender Ezubo, which bilked some 900,000 people out money making it the largest ponzi scheme by number of victims in history.
Ultimately, the amount of money coming in was no longer sufficient to cover interest payments to existing clients. The pair attempted to bury the evidence in the backyard (literally) but police, using two excavators, managed to dig up 80 bags of documents buried 20 feet underground.
The Banking Index breaks down again.
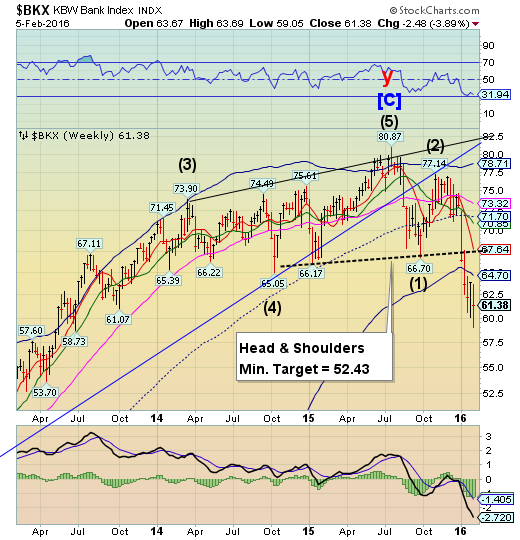
BKX made a new low on Wednesday, then made a partial retracement, remaining beneath its Cycle Bottom resistance at 64.70. The Cycles Model shows the next probable significant low the second week of February. Remember, BKX is a leading index.
(ZeroHedge) Last summer we outlined how Chinese banks obscure trillions in credit risk.
The powers that be in Beijing aren’t particularly keen on allowing the banking sector to report “real” data on souring loans - especially given the fragile state of the country’s economy. In some cases, the Politburo will pressure banks to simply roll over bad debt, effectively kicking the can. In addition, banks carry around 40% of their credit risk outside of “official loans.”
(ZeroHedge) Want to deposit cash at JPMorgan Chase (N:JPM)? Then prepare to be treated if not like a criminal, then certainly a suspect of a very serious crime. The charge: being in possession of that "barbarous relic" known as cash.
Soon, as cash becomes increasingly frowned upon, cash deposits will be slowly but surely phased out in their entirety forcing those few savers left in Obama's grand economic "recovery" experiment, to engage in commerce only in a way that allows the government to keep track of every single transaction.
(ZeroHedge) While there are numerous financial institutions in the world that are full of hidden NPLs and over-leveraged, trading at extreme levels of risk, the FSA's "Too-Interconnected-To-Fail" list of systemically critical banks is where global investors' attention is really focused.
BMO Capital Markets breaks down the world's most systemically critical financial institutions using their own "special sauce" of CDS levels, CDS term structure, equity price, liquidity, and spread trends.
(ABCNews) Italian banking shares are getting battered this year as the government tries to bundle and dispose of billions of euros in bad loans while attempting to reform and consolidate the ailing sector.
Since the start of the year, Italian banks have lost more than 35 billion euros ($39 billion) in market capitalization as investors sold their shares amid concern about some 300 billion euros in soured loans, more than 30 percent of the eurozone's total.
Economy Minister Pier Carlo Padoan told the Senate on Thursday that the banks had been caught up in "volatility hitting the global markets," with high level of bad loans on Italian banks' balance sheets attracting investors' wrath. He argued that the reaction doesn't reflect "the economic reality of Italian credit institutes."
(WSJ) Soon after his appointment last year, Deutsche Bank AG (DE:DBKGn) Co-Chief Executive John Cryan pleaded with shareholders for time. The overhaul of the big German bank “will not be easy and will take years to deliver,” he said.
Investors are already running out of patience—and not just with Deutsche. After years of lackluster results, financial scandals, painful share sales, disruptive management changes, onerous regulations and strategic U-turns, many investors are throwing in the towel on European banks.
