REVIEW
The market started the week at SPX 2077. After a gap up opening on Monday, the SPX hit 2101. On Tuesday, it hit SPX 2112, and SPX 2114 on Wednesday. Then, after a gap up opening on Thursday, the SPX hit 2124, and SPX 2129 with another gap up on Friday. For the week, the SPX/DOW rose 2.1%, the NDX/NAZ rose 4.9%, and the DJ World rose 1.9%. Economic reports for the week, which were plentiful, also came in mostly positive. On the uptick: business inventories, the CPI/PPI, housing starts, building permits, the NAHB, industrial production, capacity utilization, the NY FED; plus weekly jobless claims and the treasury surplus both improved. On the downtick: retail sales, export/import prices, the Philly FED, the WLEI and consumer sentiment. Next week, a quiet one economically, will be highlighted by Leading indicators and more reports on Housing.
LONG TERM: bull market
Two months ago, when we were doing annual updates on many of the markets worldwide, as well as the various asset classes, we wrote a report on the stock market. We did not publish the report, because we were waiting to see if the SPX downtrend would bottom in the low 2040’s and then kick off a new uptrend. With those two event now in the books, we will publish the report on Sunday. We will warn you though, the report is likely to shock both bears and bulls alike.

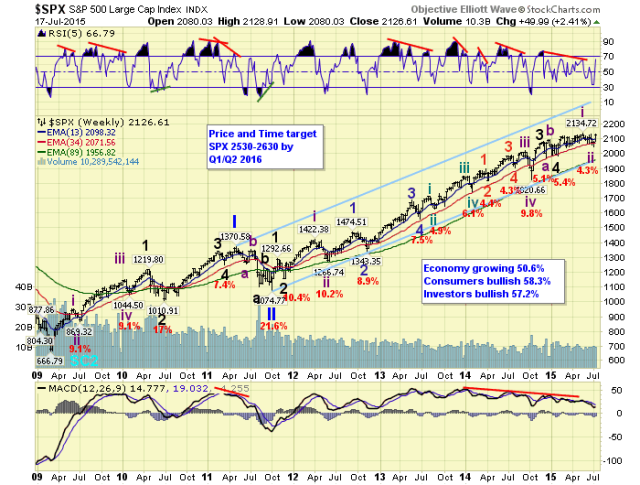
The long term count remains on track. We continue to label this bull market as Cycle wave [1] of the new Super cycle 3 multi-generational bull market. Cycle wave bull markets unfold in five Primary waves. Primary waves I and II completed in 2011, and Primary wave III has been underway since the low. Primary I divided into five Major waves, with a subdividing Major 1 and simple Major waves 3 and 5. Primary III is also dividing into five Major waves, but is alternating with that structure. Major wave 1 was simple, Major wave 3 was quite subdivided, and Major wave 5 is subdividing as well. When Primary III concludes, probably next year in the SPX 2500+ area, the largest correction since 2011 should unfold for Primary IV. Then when it concludes, Primary V should take the market to new all time highs.
MEDIUM TERM: uptrend
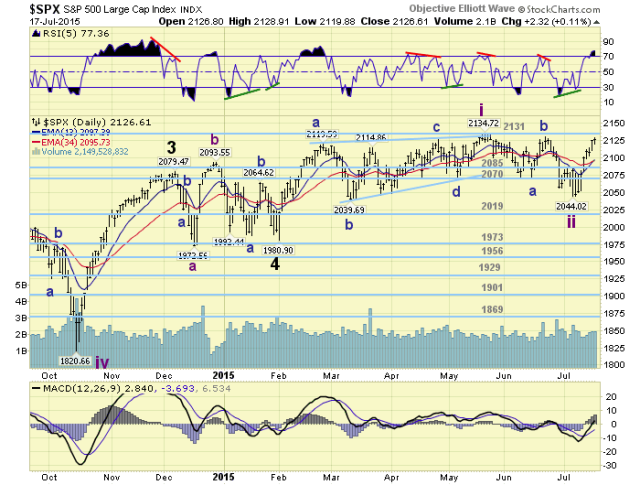
Since the beginning of the year, and even the last two months of 2014, the market traded in a narrow 160 point range with a rising bias. We had counted a Major wave 3 high in December at SPX 2079, then an irregular (usually bullish) Major 4 flat bottoming in February at SPX 1981. After that low, the market uptrended to a new high at SPX 2120 by late February, and then, oddly enough, entered a 90 point trading range for nearly five months.

We continued to see a rising uptrend from the early February low to the actual current all time high at SPX 2135 in mid-May. This wave pattern could best be described as a leading diagonal triangle (abcde). When the SPX finally completed this pattern and confirmed a downtrend, the downtrend was just as choppy as the previous several months. We considered this entire process as a high level consolidation. Our target for the downtrend was the SPX low 2040’s, since 2040 represented a 61.8% retracement of the entire February-May uptrend. A week ago, Tuesday, the SPX hit 2044, rallied to 2084, then retested that low at 2045. This retest fit quite nicely with what we were observing in the NDX/NAZ, and the short term patterns of the SPX.
From that SPX 2045 low, the market has risen for seven consecutive days with higher highs and higher lows. Recapturing all but 6 points of the entire 90 point, multi-month, downtrend in just seven days. This certainly looks like a kickoff to the Intermediate wave iii uptrend. After the uptrend confirmation occurred this week, we did some Fibonacci analysis in an attempt to project a possible Intermediate iii high. We arrived at several levels, which will get posted as they are approached. The first level, which we found quite interesting, is SPX 2198: Int. iii equals Int. i. The exact level of our OEW pivot above 2131. This suggests there is absolutely no meaningful resistance between the 2131 and 2198 pivots. Once the 2131 pivot range (2124-2138) is cleared, the market should rally right to the 2198 pivot. Medium term support is at the 2085 and 2070 pivots, with resistance at the 2131 and 2198 pivots.
SHORT TERM
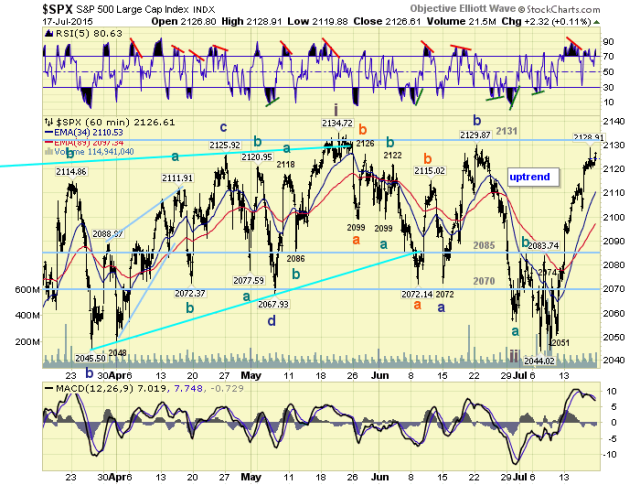
At first glance, the hourly chart looks like a bunch of a’s, b’s and c’s with a single i and ii. This is kind of choppy activity is very unusual for a bull market, as most of you know. It, unfortunately, allows for a myriad of potential counts both bullish and bearish. Unless one has a good view of the long term picture, this kind of activity can easily sway good market technicians in either direction. Since OEW quantitatively tracks the waves, we rely on it 100%. Despite the sloppy pattern, we know the uptrend ended in May, (Int. i label), and the recent downtrend ended in early July (Int. ii label). Now an Intermediate wave iii higher is underway.

From the downtrend low at SPX 2045, we have counted three waves up: 2074-2051-2129. Within the third wave, there have been five smaller waves: 2076-2067-2114-2102-2129. These five smaller waves suggest, unless the third wave extends, that SPX 2129 could have been the high for the third wave. Should this be correct, the market should pullback about 20 points early next week to around the SPX 2110 area to complete the larger fourth wave. Then we would expect another rally to a higher high than SPX 2129, before an even larger pullback. So unless this third wave extends, early next week could be somewhat choppy, as the market yet again deals with the OEW 2131 pivot. Short term support is currently at SPX 2120 and SPX 2102, with resistance at the 2131 and 2198 pivots. Short term momentum ended the week quite overbought.