REVIEW
The market did this week what it had done the previous three weeks: open higher, dip mid-week, then close the week over 2100. Last four weekly closes: 2118, 2108, 2116 and 2123. For the week the SPX/DOW were +0.40%, the NDX/NAZ were +0.85%, and the DJ World index was +0.80%. On the economic front the reports came in biased to the downside. On the uptick: business inventories, the NY FED, the WLEI, plus the budget surplus improved and weekly jobless claims were lower. On the downtick: export/import prices, the PPI, industrial production, capacity utilization, consumer sentiment, and the monetary base declined. Next week will be highlighted by the FOMC minutes, the CPI and reports on Housing.
LONG TERM: bull market
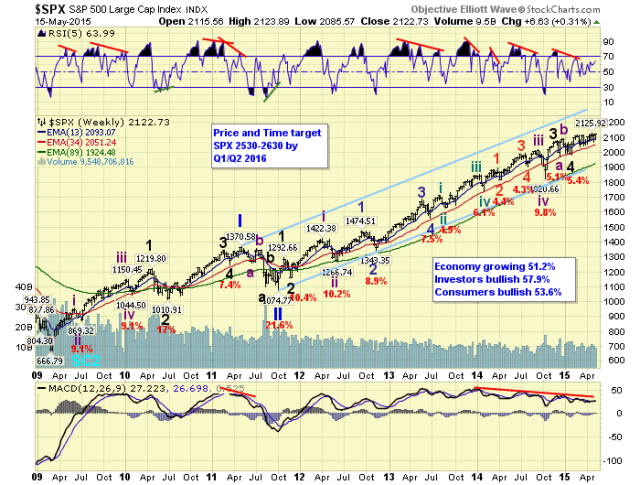
Despite the market being in drift mode for the past nearly three months, and a 150 point trading range for the past seven months, the bull market continues. This week one of our long term indicators removed the negative divergence we noted two weeks ago. This suggests when the current uptrend ends it will only be Intermediate wave i of Major wave 5. And not Major wave 5 in its entirety. As a result the Primary wave III target remains on track for SPX 2500+ by the first half of 2016. Even though it may be hard to believe the market can advance 20% in the next year, after having gained only 5% in the past eight months.

The long term pattern remains on track. Cycle wave [1], from the 2009 low, still underway. Primary waves I and II, of the five primary waves, completed in 2011. Primary III has been underway since that October 2011 low. Primary I had five Major waves: with a subdividing Major 1 and simple Majors 3 and 5. Primary III has five Major waves: with a simple Major 1, a complex subdividing Major 3, and probably a subdividing Major 5 as well. The bull market remains on track to conclude in 2017.
MEDIUM TERM: still an uptrend
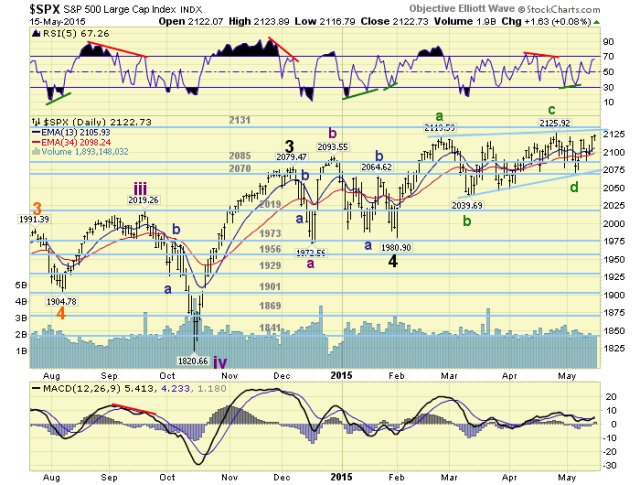
After completing a downtrend low in early-February, which we labeled Major wave 4, the market impulse higher until late-February when hitting SPX 2120. Since then, unfortunately for those tracking the waves, the market has remained in drift mode, an 85 point range, with a slight bias to the upside. After several attempts to label this activity, as the market has moved in starts and stops. This choppy activity looks like a rising diagonal triangle uptrend.

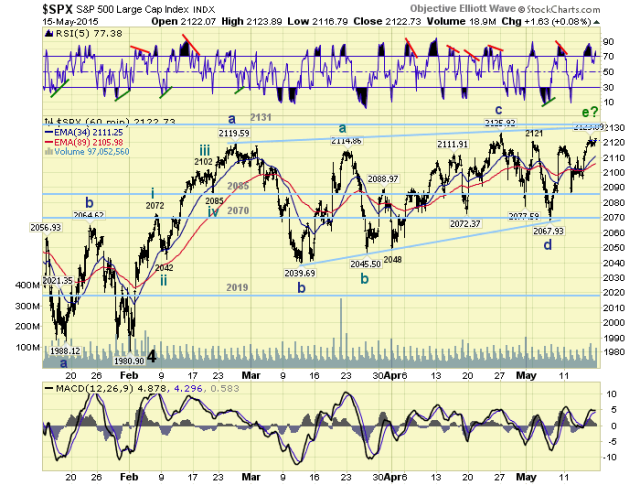
We have labeled it with five Minor waves: a: 2120, b: 2040, c: 2126, d: 2068, e: underway. The trend lines drawn connecting the tops and lows define the typical wave formation of a rising wedge. The upper trend line, where wave E has been trying to complete is currently right about at the OEW 2131 pivot. Typically a diagonal hits that trend line before it completes. Sometimes it falls a bit short, or even overshoots it by a few points. We believe any overshoot should be limited to the 2131 pivot range (2124-2138). Should the market rally beyond this we would have to think some other pattern is underway. For now the uptrend from the early-February low continues. Medium term support remains at the 2085 and 2070 pivots, with resistance the 2131 and 2198 pivots.
SHORT TERM
Typically during a diagonal triangle Minor waves a, c, and e have a Fibonacci relationship to each other. During this one, Minor c (86 pts.) equaled a near exact 0.618 relationship to Minor a (139 pts.). This would suggest Minor e should have had the same 0.618 relationship and topped out at SPX 2121, for a failed e wave. On Friday it travelled a bit further hitting SPX 2124 right at the open. The other relationship is wave d (58 pts.) to wave b (80 pts.), which is a non-Fibonacci 0.725 relationship. This would project a high of SPX 2130.

As long as the diagonal triangle uptrend pattern holds the OEW 2131 pivot range, we can expect the next correction to take the SPX back down to the 2040 area, or worse case the 2019 pivot range. This would complete Intermediate wave ii, and an Intermediate wave iii to new highs would follow. Sometimes it just requires patience to allow the market to set itself up for the next important move. Short term support is at the 2085 and 2070 pivots, with resistance at the 2131 and 2198 pivots. Short term momentum ended the week declining from extremely overbought.