

-- VIX extended its Master Cycle low, three weeks later than the usual time.It occurred in the form of a rare triple zigzag formation. This leaves the “fear indicator” not positioned to warn of potential challenges ahead.
SPX ramps again.

SPX ramped for the sixth time above its weekly Intermediate-term support at 2068.16 since last December.This sideways motion for the past three months has done nothing for neither the bulls nor the bears.It is clear, however, that each ramp becomes weaker, leading to a probable break of support very soon. The uptrend may be broken at the long-term trendline at 1965.00 The next decline may not be saved at Long-term support as the last one did on October 15.
(Bloomberg) The Standard & Poor’s 500 Index rallied to within 1 percent of its all-time high after General Electric Co. announced a broad restructuring plan and investors awaited further clues on the strength of corporate profits.
GE rose the most in six years after saying it plans to exit the majority of its finance business, and it authorized a stock buyback of as much as $50 billion. Health-care companies advanced for a sixth day. Netflix Inc (NASDAQ:NFLX). climbed more than 3.4 percent, while financial stocks lagged as insurance companies slipped.
NDX bounces between support and resistance.
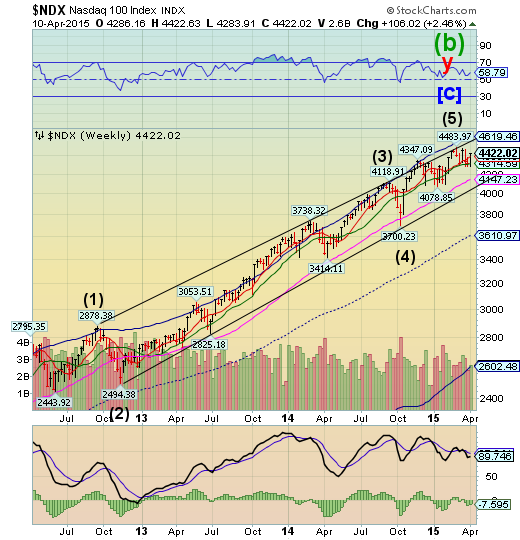
NDX closed above weekly Short-term resistance at 4390.15 this week, but still beneath its peak at 4483.97. Closing above these levels gives no warning to investors that an important Cycle low may be due in the next two weeks.
(MarketWatch)—General Electric Co.’s $50 billion share buyback program unveiled early Friday is massive, but pales compared with the $90 billion program announced by Apple Inc (NASDAQ:AAPL). in March 2014.
Apple’s AAPL, +0.00% stunning $90 billion program approved in April 2014 is still the biggest-ever share buyback program authorized by a U.S. company, according to Dealogic data.
GE comes in second place, followed by Microsoft Corp (NASDAQ:MSFT). MSFT, -0.02% with a $40 billion program approved in September 2008 that was followed in September 2013 by another $40 billion authorization.
High Yield rallies above resistance.

After an “inside” week, the High Yield Index rallied above Long-term resistance at 142.10.However, it is imperative that it break out above its early February high of 145.37 to resume any modicum of bullishness. The Cup with Handle formation has a very high probability of success once it is triggered. A failure at this point may cause difficulties in new high yield financing that has helped finance stock buybacks, especially in the NASDAQ.
(ZeroHedge) Back in February 2013, when then-Fed governor Jeremy Stein commented on the "overheating in the credit market", he noted that "the annualized rates of PIK bond issuance and of covenant-lite loan issuance in the fourth quarter of 2012 were comparable to highs from 2007." Indicatively the percentage of covenant-lite deals as a percentage of total then was a little under 30%. Shortly after that he quietly left the Marriner Eccles building, knowing well what is coming, and a good thing he did because since then the bubble across all credit products has left many dumbfounded, and nowhere is this more obvious than in the total volume of cov-lite deals, which has doubled since Stein's letter, and is now approximately at two third of all loan issuance.
In other words, just one third of all loans are not covenant lite.
The euro fails its rally at Short-term resistance.

Last week I mentioned that, “The euro appears ready to attempt a “second chance” rally to its weekly Cycle Bottom at 114.12.” However, the rally was stopped at weekly Short-term resistance at 109.79. This development is not good for the bulls.
(WSJ) The euro is a symbol of European unity. But the euro symbol is falling apart and it will cost a lot of euros to fix.
In the center of the eurozone’s financial capital stands a 46-foot-tall icon of the common currency. And like the currency itself, the sculpture faces a crisis.
Light bulbs need to be replaced inside the symbol, which consists of a giant blue “€” spangled with 12 yellow stars. Bumper stickers mar its exterior. Vandals recently painted one star red.
The euro-statue’s troubles are even upsetting tourists. An Austrian visitor to Frankfurt recently wrote an open letter to the mayor in a local newspaper saying he was “appalled” at the “miserable” condition of the sculpture. “The sculpture is more than a simple structure. It stands for the currency and with that the future and hopes of over 300 million people,” the letter said.
DJ Euro Stoxx rally another week.

The Euro Stoxx 50 powered higher above the upper trendline of the Orthodox Broadening top during a Cyclical period of strength. However, the next two weeks may bring a reversal of fortune as further Cyclical weakness sets in. Could a rising euro reverse this trend?
(Reuters) - Stock market investors, looking for that little bit of "alpha" that will help them outperform the market, are starting to position themselves for any stabilisation in the euro.
The currency of the euro zone has been hit hard this year, pulled down by a strengthening U.S. dollar and the European Central Bank's programme of record-low interest rates and bond-buying.
But some investors are seeing signs of a recovery. The euro bounced off its March lows, and recent economic data have shown signs of a pick-up in Europe.
That has led them to shift out of sectors that gained from a weak euro -- such as export-sensitive European auto stocks -- and into areas that have not fared quite as well, such as European banks .
The yen tests Cycle Bottom support.

The yen tested its Cycle bottom support at 82.29 this week, maintaining its sideways consolidation. If this observation is valid, the yen may now rally for the next two weeks or more.
(Bloomberg) State Street Global Advisors Inc. is taking a contrarian stance on the yen, forecasting the currency will strengthen as much as 7 percent versus the dollar by year-end, even as peers see it sliding.
“We’ll see the yen appreciate versus just about everything this year,” according to Collin Crownover, the money manager’s Boston-based head of currency management. “The Bank of Japan probably won’t do the amount of easing that’s priced into the market. As people start to price that out, is when you see a rally in the yen.”
The Nikkei may be finalizing its rally.

The Nikkei may have made its final challenge of the upper trendline of its Orthodox Broadening Top. The Broadening top represents a market that is out of control and has a highly emotional public participation. The Nikkei at 20000 represents both round number resistance and its previous high in 2000. Both of these resistances pose a risk to the continuation of the rally.
(WSJ) In a show of increasing global appetite for Asian stocks, the region’s markets took off this week with Hong Kong gaining the most in more than three years and Tokyo’s Nikkei Stock Average breaking 20000 for the first time in 15 years.
The Hang Seng Index ended a three-day week up 7.9% at 27272.39 as its rally accelerated on Wednesday following holidays. The index hadn’t gained as much in a week since October 2011. Investors said cheap stocks and the prospect of greater demand from the mainland drove the gains, as well as momentum buying because the market was going up.
U.S. dollar reaches a Trading cycle high, may decline.

The US dollar reached a probable trading cycle high today. The Cycles Model calls for a month-long decline as far as mid-cycle support, currently at 84.06. Critical support is at the Cycle Top at 94.55. Dollar longs may be crushed in a decline beneath that level.
(Reuters) - Speculators trimmed positive bets on the U.S. dollar for a second straight week, according to data from the Commodity Futures Trading Commission and Thomson Reuters released on Friday.
The value of the dollar's net long position slipped to $40.27 billion in the week ended April 7, from $40.37 billion the previous week. This is the third straight week that net long dollars hit at least $40 billion.
USB pullback begins.

The Long Bond may be starting its pullback to support at 157.13. There is a shortage of quality bonds and notes, especially the 10-year Treasury Notes. A decline beneath the weekly cycle top currently at 157.13 may incite a longer, deeper reaction.
(WSJ) U.S. Treasury bonds perked up Friday but posted the biggest weekly selloff in more than a month.
The mixed results suggest investors continue to grapple with the prospect of a major shift in U.S. monetary policy and low bond yields permeating in developed countries.
The Federal Reserve is prepared to raise interest rates for the first time since 2006 and investors are concerned the tightening campaign could hurt the value of outstanding bonds.
Gold rallies, but short of Long-term resistance.

Gold challenged weekly Intermediate-Term resistance at 1215.14, but closed back beneath it. The turn was at the 50% Fibonacci retracement level, which reinforces the view that it may be completing the right shoulder of the Head & Shoulders formation. A failure beneath 1141.60 triggers the formation with a minimum target of 975.20.
Crude rallied further, completes a flat top correction.

Crude completed a Primary Cycle high on April 7, forming an expanded flat correction. It closed beneath its weekly Cycle Bottom support/resistance at 51.96, raising the probability of a further decline through mid-to-late May. Crude has a new potential Wave 5 target at 32.00.
(OilPrice.com) Last week we saw another 10MB massive crude oil build domestically at a time when US production is flattening, refinery capacity is rising and gasoline demand is growing (5% year over year vs. 3% or lower in the recent past). This divergence can be explained in part from the rising import of heavier oil which accounted for 6.1MB (869,000 B/D) of the 10MB build last week. Imports for the week rose a whopping 6.5% sequentially and 8.5% vs. the 4 week moving average! Once again the chase to create sensationalistic headlines to drive down oil is self-evident as US production rose a meager 14,000B/D and was not the main cause of the rise. So why, month after month since 2014, have imports risen when there exists a “glut” in US oil inventories?
Shanghai Index at a Trading Cycle high?

The Shanghai Index may have put in a Trading Cycle high today as it completes the end of its year-long bull run.The Cycles Model suggests a probable turn may be imminent. Retail investors are piling onto this index, which is a good indication of an overbought market.
(ZeroHedge) Amid a historic margin-fueled equity frenzy in mainland China that has tech stocks trading at 200X and has driven a wave of new, possibly literate “investors” to open more than 4 million stock trading accounts in the past 30 days alone, and with money now pouring into “undervalued” (and that’s now a very relative term) Hong Kong shares sending the Hang Seng up 10% in just one week, some might suggest that there’s a (super) bubble forming in Asia and that would be bad for all of the housewives who have recently taken up day trading as their favorite hobby. Here to explain why there’s no bubble and why investors should "enjoy the ride", are FT and HSBC (LONDON:HSBA).
The Banking Index bounces again.

--BKX has traded in a flat range since early 2014, but still hasn’t broken critical support. This kind of consolidation, without breaking through resistance areas, is bearish but frustrating until supports finally give way.A resumption of the decline may break several critical supports and trigger as many as three bearish formations. The Cycles Model now implies that the next decline may last throughlate April. Could this be a waterfall event?
(NYT) Jeffrey R. Immelt, the chief executive of General Electric, has plotted an escape for GE Capital from onerous regulation. He is offloading most of the conglomerate’s finance unit, which should allow it to ditch the tag imposed by watchdogs of being a systemically important financial institution, or SIFI. Big United States banks might fancy similar liberty, but they are more tightly hemmed in.
GE Capital plans to shed about three-quarters of the $360 billion in assets it had on its balance sheet at the end of 2014. That will leave the unit with no deposits, little or no securitization inventory, a far smaller international business and hugely reduced debt needs, including for the commercial paper that caused so much angst during the 2008 financial crisis.
(NYT) A strange thing is happening as Greece struggles to avert bankruptcy: Its troubled banks are loading up on more debt.
These short-term bonds, which have been issued by the country’s largest banks and carry the guarantee of the Greek government, are not being sold to foreign investors. They are being issued to the only entity that would dare buy them: themselves.
(ZeroHedge) Selling billions of dollars worth of insurance on things that turn out to, on occasion, exhibit extraordinary volatility can be a dangerous thing — just ask AIG which was sucked dry by collateral calls from a certain vampire squid when the M2M value of the MBS the company so foolishly insured cratered in 2008 and Goldman came banging on the door for its money. And while the value of the price hedges (i.e. insurance contracts) the US banking sector has sold to the country’s now beleaguered shale drillers may not be large enough to present an imminent systemic risk, as Bloomberg notes, “$26 billion is still $26 billion”:
(ZeroHedge) There was only bad news in the just released Fed consumer credit report for the month of February.First, the "good credit", the one that consumer should load up on when they feel comfortable about the future, i.e., credit card, or revolving debt, continued its recent plunge, and in February crashed by $3.7 billion, following January's $1 billion plunge.This was the worst month for revolving credit since December 2010 and explains perfectly why the consumer has literally gone into hibernation - it has nothing to do with the weather, and everything to do with the unwillingness to "charge" purchases, which in turn is a clear glimpse into how the US consumer sees their financial and economic future.