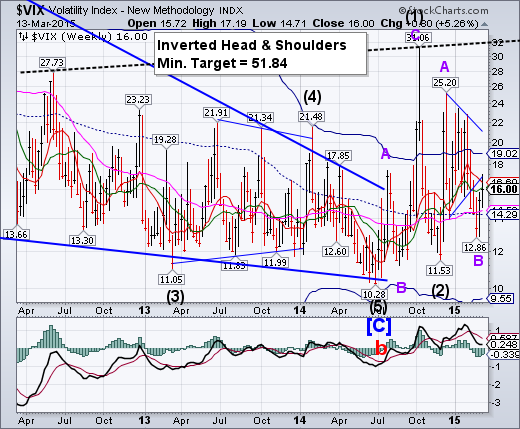
-- VIX challenged Intermediate-term resistance at 16.17, but did not close above it this week. A rally above Short-term resistance at 16.60 and Cycle Top resistance at 19.02 may put the VIX into high gear..
SPX loses its supports.
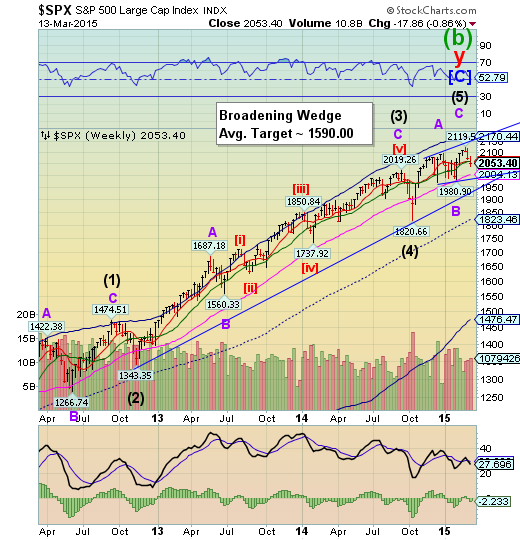
SPX closed beneath Short-term support at 2062.02 this week. Long-term support at 2004.13 and the Broadening Wedge trendline puts the uptrend in jeopardy. The uptrend may be broken at the long-term trendline at 1950.00 The next decline may not be saved at Long-term support as the last one did on January 29.
(MarketWatch)—U.S. stocks suffered another bout of selling on Friday and the main indexes registered losses for a third straight week.
The turbulent week was dominated by wild swings in currencies, with the dollar surging to multiyear highs against the euro as expectations rose for a rate hike by the middle of the year.
Oil prices fell nearly 10% over the week as the commodity had been hit hard due to a stronger dollar, reports of a supply glut and heightened output. Weaker-than-expected economic data added to the dour Wall Street mood.
NDX is testing technical supports.
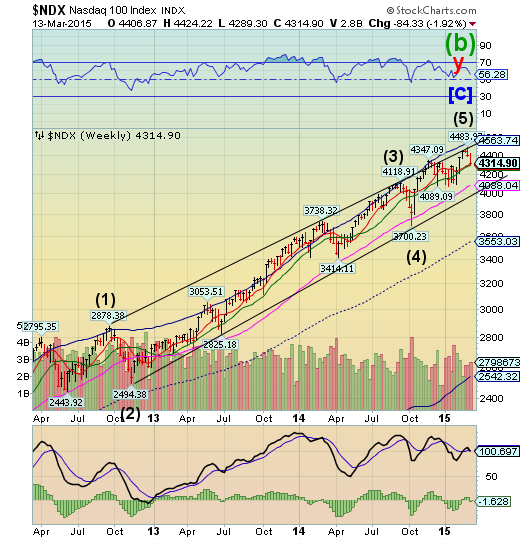
NDX closed just above Short-term support at 4308.81. Intermediate-term support is just beneath it at 4289.83.A break of these supports may send the NDX into a deeper decline towards Long-term support and the trendline..
(ZeroHedge) And so, a little over a year after the last debt ceiling melodrama, in which the US kicked the can on its maximum borrowing capacity to this Sunday, March 15, in the meantime raking up total US public debt to $18.149 trillion...
... the soap opera with the self-imposed borrowing ceiling on America's "credit card" is back, and the US is once again faced with sad reality of its debt ceiling (now at well over 100% of America's upward revised GDP of $17.7 trillion). The reason: two days from today Congress’s temporary suspension of the debt ceiling, which was approved in February 2014, ends.
As Bloomberg reports, Treasury Secretary Jacob J. Lew called on lawmakers to raise the country’s borrowing limit and avoid playing politics when the U.S. government’s credit rating is at stake.
DJ High Yield Select 10 ETN (NYSE:DOD) approaches a trigger point.
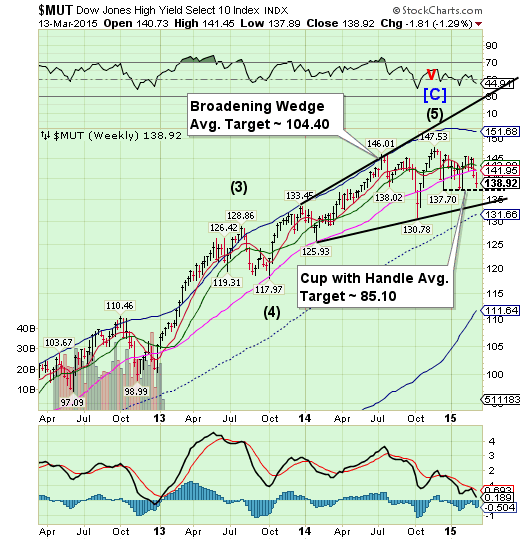
The High Yield Index is now challenging the Cup with Handle formation at 137.80.The Cup with Handle formation has a very high probability of success once it is triggered.A failure at this point may cause difficulties in new high yield financing that has helped finance stock buybacks.
(Forbes) Retail cash flows for U.S. high-yield funds turned deeply negative, with a $1.96 billion withdrawal, in the week ended March 11, according to Lipper. However, it was almost entirely tied to the exchange-traded-fund segment, at 97% of the total, or $1.91 billion, on top of a miniscule $50 million mutual fund redemption.
Such a dynamic hasn’t been seen since the week ended Jan. 29, 2014, when a net $908 million outflow was 99% ETF-related. It’s an expansion of ETF activity from last week, when the mutual fund inflow of $616 million was seriously dented by an outflow of $307 million from ETFs.
The euro reaches initial downside target.
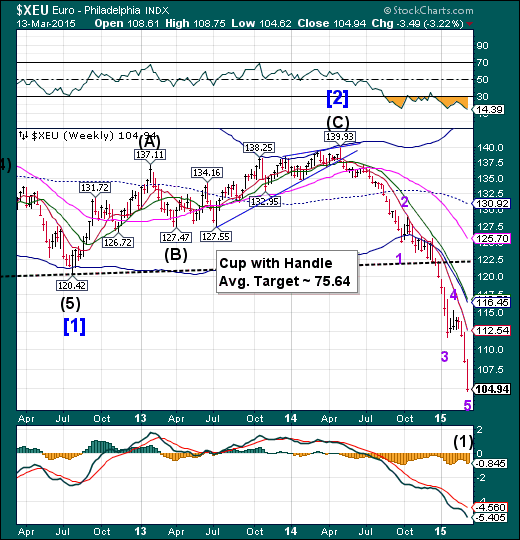
The euro reached its initial downside target of 105.00 in Minor Wave 5.It anticipates its next Master Cycle low (Wave 5)momentarily, which may surprise the short-sellers. Monday is a potential turn date, so we must stay on the alert.
(MarketWatch) — You ain’t seen nothing yet when it comes to the euro’s grind lower toward parity against the dollar, according to Goldman Sachs.
The chief forex strategist at the investment bank, Robin Brooks, just slashed his forecast for the shared currency EUR/USD, -1.32% and said it will be worth the same as the dollar in September this year — a sharp revision from the previous outlook that didn’t call for parity until late 2016. The euro traded at $1.0532 on Friday.
“We therefore expect more downside in the near term, with the expected removal of ‘patient’ at next week’s FOMC [meeting] a key catalyst,” he said in a note on Friday. “The normalization of U.S. monetary policy is a powerful — if underappreciated — force for [a lower euro-dollar] looking ahead.”
EuroStoxx continues to challenge its Broadening Top.
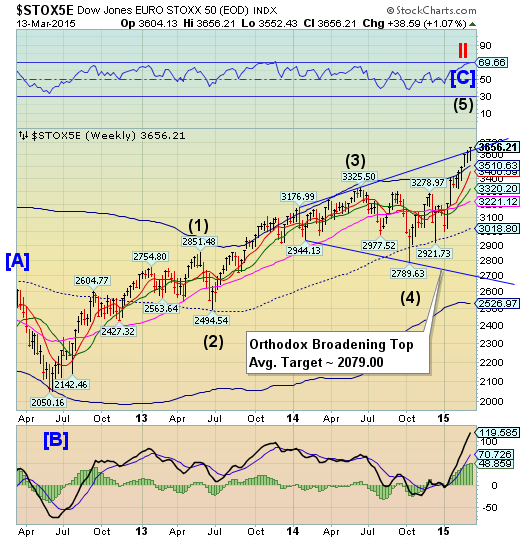
The EuroStoxx 50 Index appears to have overshot the upper trendline of its Orthodox Broadening Top. This may be a case of “Buy the rumor and sell the news.”The Cycles Model now suggests the top is only days away. Could tomorrow’s Pi date (3.14.15) be a clue?
(Reuters) - European stocks slipped on Friday, taking a breather from their almost-uninterrupted rally since the start of the year, with energy and mining shares falling along with commodity prices.
Resource-related stocks led the retreat as French oil major Total fell 2.7 percent and global mining company Rio Tinto (LONDON:RIO) dropped 1.9 percent.
Shares in Eni sank 5.4 percent after the Italian energy firm cut its dividend, slashed investments and suspended its share buyback programme.
Spain's Sabadell was down 3.5 percent, falling for a second day. A source told Reuters the bank was considering a 1.5 billion-euro capital increase via a share issue to fund a bid for Britain's TSB, which was announced on Thursday.
The yen may may be ready for a bounce.
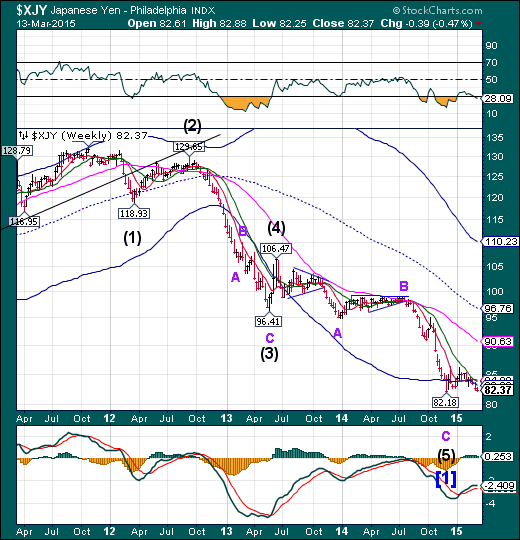
The yen continues to hover above its December 5 low. What’s at stake here is that it is now due for another Master cycle low. This may give the yen the opportunity to rally for up to a month before resuming its downtrend.
(WSJ) Japan has been celebrating the fall of the yen for the past two years. The currency is now reaching levels that could make policy makers wonder if they’ve gone too far.
The yen has cruised through 120 to the dollar, nearing the key 125 level that officials in Tokyo have signaled would be a tipping point for concern. Etsuro Honda, a top adviser to Prime Minister Shinzo Abe on economic policy, told The Wall Street Journal in November that if the yen weakens to 125 it would make him “nervous” and make him “stop and think, ‘is this OK?’”
The Nikkei is nearing upper trendline resistance.
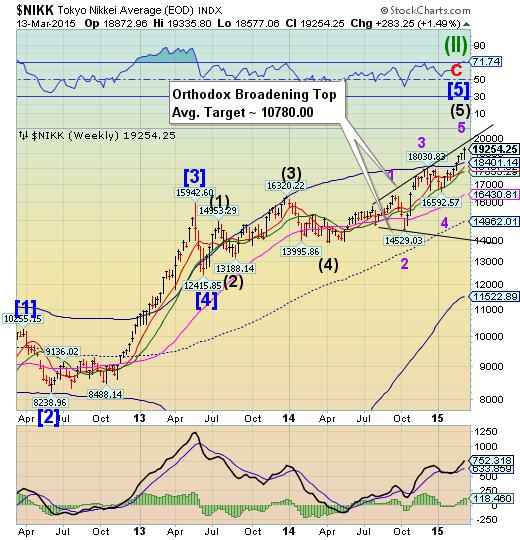
The Nikkei appears to have made a final surge in the week of its 6-year anniversary of the March 9, 2009 low.The risk of a reversal is mounting.The Orthodox Broadening Top agrees with that outcome, since it represents a market that is out of control and has a highly emotional public participation.This may be the start of a dramatic decline that may start imminently.
(ZeroHedge) Since 2010, The Bank of Japan has 'openly' - no conspiracy theory here - been a buyer of Japanese stock ETFs. Their bravado increased as the years passed and Abe pressured them from their independence to 'show' that his policies were working to the point that in September 2014, The BoJ bought a record amount of Japanese stock ETFs taking its holdings to over 1.5% of the entire market cap, surpassing Nippon Life as the largest individual holder of Japanese stocks. However, as WSJ reports, The BoJ has now gone full intervention-tard - buying Japanese stocks on 76% of the days when the market opened lower.
U.S. dollar near its target, may reverse abruptly.
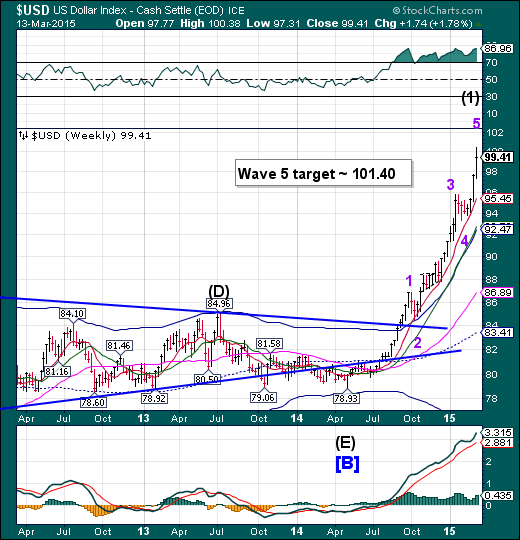
The US dollar came within 102 ticks of its target at 101.40. This has been an extended rally and the Cycle is getting stretched, so even if its probes that level on Monday, it may lose its grip in a reversal. It’s time for caution here.
(Reuters) - Positive bets on the U.S. dollar rose to its highest level in four weeks as some speculators rebuilt bearish bets on the euro as the European Central Bank started its 1.1 trillion euro bond stimulus program this week, according to data from the Commodity Futures Trading Commission released on Friday.
The value of the dollar's net long position was $44.31 billion in the week ended March 10, from $40.85 billion the previous week.
This was the 11th consecutive week that dollar longs have hit at least $40 billion.
USB ends its shake out.
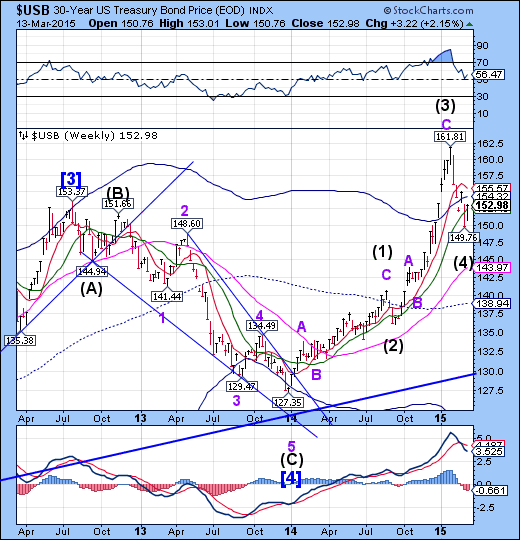
The Long Bond has ended its shake out of weaker hands and reversed higher this week. Cycle rotation now favors bonds over stocks as a major turn in virtually all assets may be upon us. It appears that this trend may continue through late April before a significant pullback.
(ZeroHedge) Kicking off the weekly Treasury issuance was today's 3 Year auction which was another very strong auction, with the High Yield of 1.104%, despite being the highest since April 2011, pricing 1.1 bps inside of the When Issued at 1.115% at 1 pm. The Bid to Cover of 3.33 was right on top of the TTM average, and just a fraction below the 3.345 in January.
But the real story was in the internals, which again saw subdued Directs interest, who took down 8% of the final allotment, it was the Indirects (i.e., foreign central banks) which once again loaded up, taking down 51.4% of the auction, which was also the highest Indirect takedown since March 2010
Gold hesitates above the Cup with Handle formation.
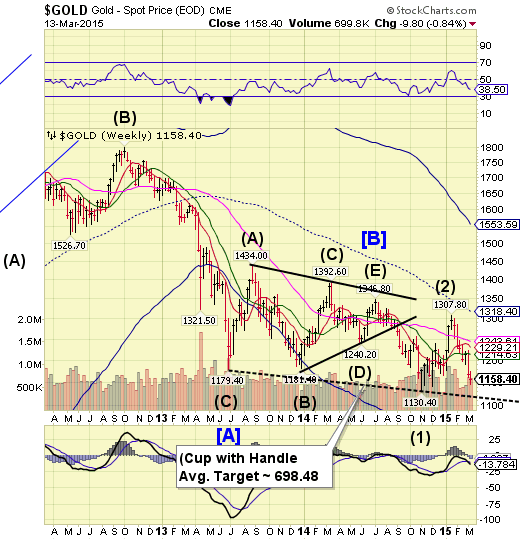
Gold hesitated in its decline to the Lip of its Cup with Handle formation. It may be due for a minor bounce or a sideways consolidation for a few days. However, once beneath the formation the decline may last through the end of March before the next bounce.
(Bloomberg) -- Gold traded near the lowest since December before Federal Reserve policy makers meet next week to discuss the outlook for raising interest rates.
Prices headed for a second weekly loss as the dollar rose to a 12-year high against the euro, cutting the appeal of the metal as an alternative asset. Spot gold dropped 4.9 percent in the previous nine sessions, the longest slump since January 1998.
Investors have sold the metal amid concern that the Fed is getting closer to raising interest rates for the first time since 2006, damping gold’s allure because the metal generally offers returns only through price gains. Policy makers will meet March 17-18.
Crude may now shake out the shorts...
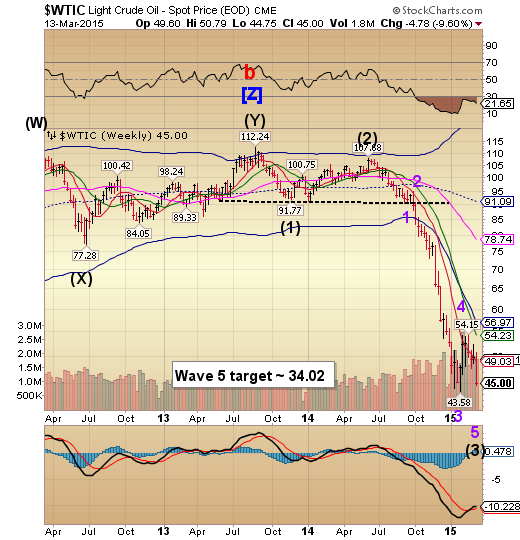
Crude declined impulsively this week, but may be ripe for a reversal back to the cluster of Model resistances from 54.23 to 56.97.This may be the real shakeout since the shorts have piled back on. This move has something for everyone, as it went against the longs who piled on last month. Now it may tackle the shorts again.
(Reuters) - Global oil prices tumbled on Friday and fell 9 percent on the week, hit by a renewed rally in the dollar and a warning by the International Energy Agency (IEA) that the oil glut is growing.
Data that showed a sharp drop in the number of U.S. rigs drilling for oil failed to inspire market bulls.
Benchmark Brent oil settled near a one-month low below $55 a barrel and U.S. crude settled near a 2-1/2 month low under $45.
Shanghai Index forms a bearish Megaphone.
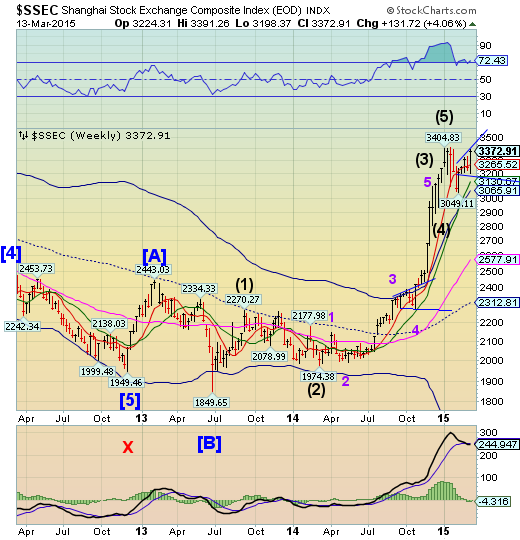
The Shanghai Index attempted to regain its former ascendancy this week, but failed, leaving a bearish Megaphone pattern. A decline below 3200.00 may trigger the formation. Volatility is on the rise in China, despite massive liquidity injections.
(Bloomberg) -- China’s stocks rose, with the benchmark index capping its biggest weekly gain in a month, as the central bank endorsed the flow of funds into shares and coal companies surged on a government pledge to curb oversupply.
Yanzhou Coal Mining Co. rallied by the 10 percent daily limit. Ping An Bank Co. climbed 2.7 percent after saying net income increased 30 percent last year. China Southern Airlines Co. and Air China Ltd. advanced more than 6 percent after U.S. crude dropped to a six-week low.
The Shanghai Composite Index climbed 0.7 percent to 3,372.91 at the close, extending its increase this week to 4.1 percent. People’s Bank of China governor Zhou Xiaochuan said at a press conference on Thursday he disagreed with the view that credit funds flowing to the equity market aren’t helpful to economic growth.
The Banking Index tests its supports.
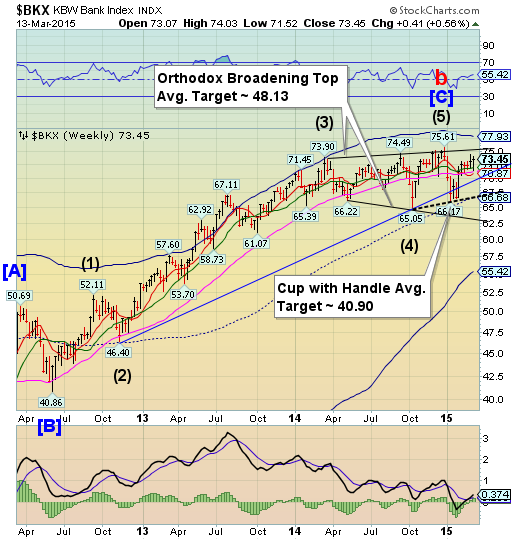
--BKX tested its Intermediate-term support at 71.91, but close above it for the week. This is the index that will lead equities and commodities in their next decline.The Cycles Model now implies that the next decline may last through mid-April. Could this be a waterfall event?
(Reuters) - Four of the largest U.S. banks just scraped by in an annual Federal Reserve check-up on the industry's health, underscoring their top regulator's enduring doubts about Wall Street's resilience more than six years after the crisis.
Goldman Sachs Group Inc (NYSE:GS.N), Morgan Stanley (NYSE:MS.N) and JPMorgan Chase & Co(NYSE:JPM.N), all with large and risky trading operations, lowered their ambitions for dividends and share buybacks, the Fed said on Wednesday, to keep them robust enough to withstand a hypothetical financial crisis. The revised plans allowed them to pass the Fed's simulation of a severe recession.
And Bank of America Corp (NYSE:BAC.N) was told to get a better grip on its internal controls and its data models even as the Fed approved its payout plans after the so-called stress tests.
"Bank of America exhibited deficiencies in its capital planning process.... in certain aspects of (its) loss and revenue modeling practices," the Fed said.
(WSJ) Several German banks could lose up to 10% of their net profit this year following Austria’s decision to halt debt repayments from bad bank Heta Asset Resolution, and one lender will need fresh capital to avoid failure, ratings firm Fitch said Thursday.
“Assuming a haircut of 50% and that German banks hold around 40% of Heta’s liabilities that are affected by the moratorium... we estimate this could cost up to 10% of the [German] sector’s 2015 net profit,” Fitch said.
(ZeroHedge) The idea of the “zombie bank” has become rather ubiquitous since 2008 and in a landscape characterized by both multi-billion dollar legal settlements stemming from crisis-era malfeasance (the public utility vs. bankruptcytrade-off) and hopelessly depressed NIM thanks to artificially suppressed rates, we’re not surprised that a bit of creativity is required to keep both regulators and shareholders pacified. As Reuters notes, one preferred (pardon the pun) route for banks of late has been a simple version of left-to-right pocket accounting:
