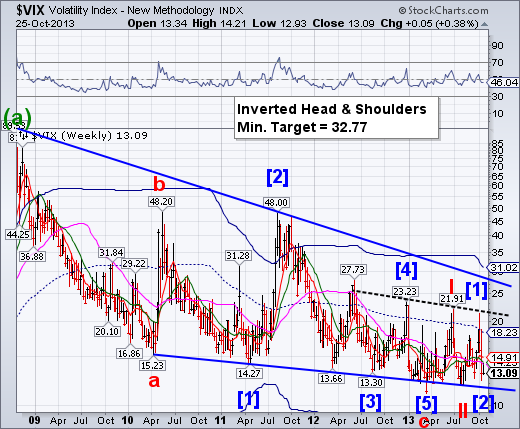
VIX rose up to weekly Short-term resistance at 14.23 this week before partially correcting the move.The VIX had a very important cyclical anniversary last Friday, which coincided with its low.This appears to be a fulcrum for an unexpected reversal over the next several weeks.
SPX jammed Cycle Top resistance. 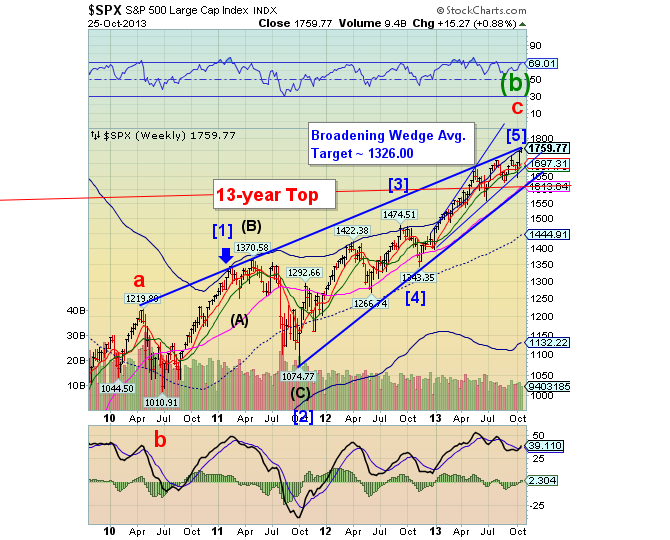
SPX jammed up against its Weekly Cycle Top resistance and trendline at 1760.00 at the close on Friday.Trendline resistance held the last three times an attempt was made at the top and there is good reason to believe it may hold this time as well. NYSE margin debt rose nearly 4.8% in the month of September to an all-time high of $401,239,000,000.00.
(ZeroHedge) Of course, it wouldn't be Friday if we didn't melt-up into the close (helped by a VIX slammer) and sure enough the S&P tagged its all-time highs as panic buying ensued with just minutes left in the week. Headlines will crow of new all-time-highs for the S&P (but credit remains a non-believer, not buying the rip).
NDX slams into the Broadening Top trendline.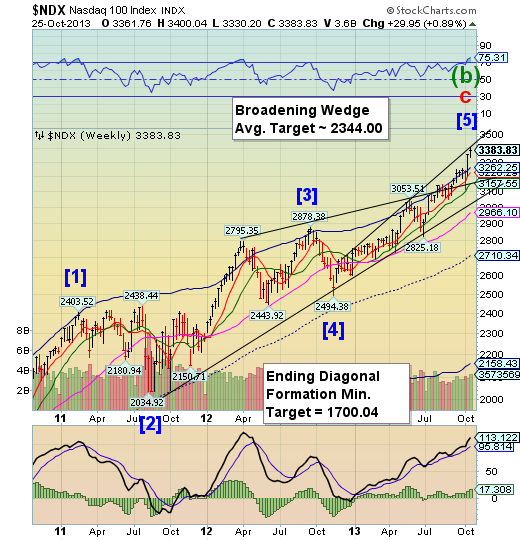
NDX extended its throw-over of its Ending Diagonal formation to make another attempt the upper trendline of its Broadening Wedge formation.The Broadening Wedge formation has the same lower trendline as the Ending Diagonal, suggesting an average decline to 2344.00 once it declines beneath 3100.00. A decline beneath the Diagonal formation may quickly lead to a break of the formation as well, triggering multiple bearish formations.
(ZeroHedge) As we head into the vinegar strokes of 2013 with the world awash with liquidity and ever ready to BTFATH, we note that the last time the S&P 500 saw two consecutive years when the index did not go negative year-to-date was 1975-1976. As Bloomberg notes, just as in 2012 and 2013, we have not seen one day close below the previous year's closing level but as Marketfield's Michael Shaoul comments "eventually circumstances will change sufficiently to make the equity market a treacherous place."
The Euro meets its Cycle Top. 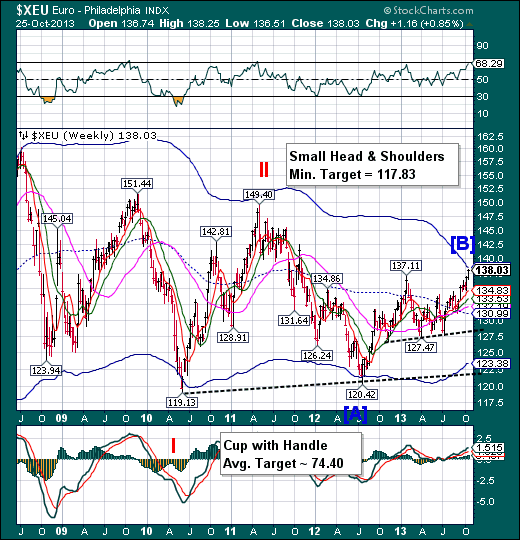
TheEuronearly hit its Cycle Top resistance at 138.60.The uptrend in the Euro over the past six weeks has been amazing, but it may not last. The Cycles suggest a change in trend may happen over the weekend.
(BBCNews) The summer is past and European summits return. Europe's leaders gather in Brussels on Thursday with the markets becalmed and some economic statistics to celebrate.
Even the threat - a few weeks back - of the Italian government falling scarcely ruffled the markets. The promise by the president of the European Central Bank, Mario Draghi, a year ago, to do whatever it takes to defend the euro continues to act as a shield against the bond market vigilantes. No one, it seems, is prepared to bet against the ECB.
Famous last words?
TheYenis finishing its consolidation.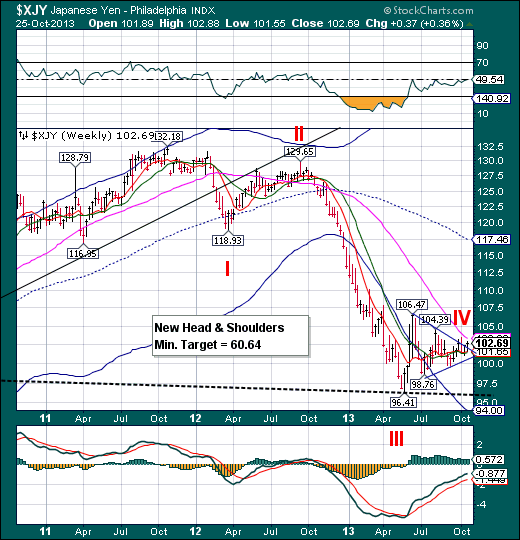
The Yen may have ended its Triangle formation which indicates a continuation of its prior trend.The Cycles Model suggests an imminent sharp decline that may challenge the Head & Shoulders neckline at 96.00.As the Yen loses its supports, the decline may shortly resume beneath the neckline in a Cycle Wave V, carrying it to new lows.
(USAToday) A magnitude-7.1 earthquake struck off the Fukushima region of Japan on Saturday local time, triggering tsunami-driven waves that hit three cities along a 200-mile stretch of the east coast that was briefly under a tsunami advisory.
The epicenter was located 231 miles east of Japan's Honshu Island at a depth of 6 miles, according to the U.S. Geological Service. The tremor was felt 300 miles away in Tokyo.
The US Dollar“throws under” a Falling Wedge. 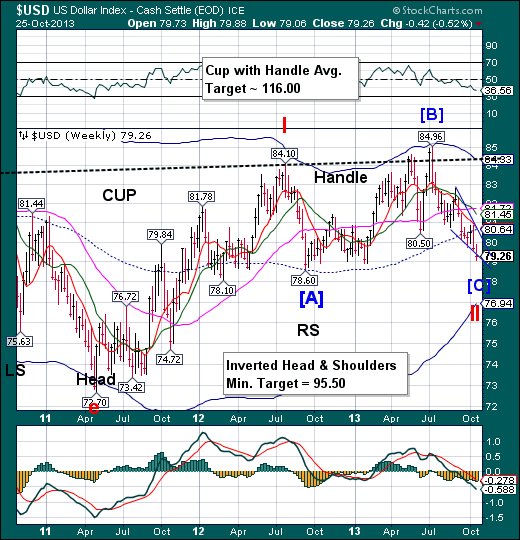
USDthrew under a Falling Wedge formation, indicating a final thrust in its decline.This may be the completion of a 16 month-long Expanded Flat correction before moving considerably higher.For now, the long-term uptrend is still intact and a reversal back above the Falling Wedge will keep it that way.
(Bloomberg) The dollar traded at almost the weakest level in two years versus the euro after U.S. consumer sentiment fell to a 10-month low, adding to bets the economy is struggling and the Federal Reserve will delay cutting stimulus.
The greenback slid for a second week versus the yen as orders (DGNOXTCH) fell for U.S. durable goods other than transportation equipment. The Fed, which meets next week, will put off slowing bond purchases until March, economists forecast.
Goldmeets its trendline. 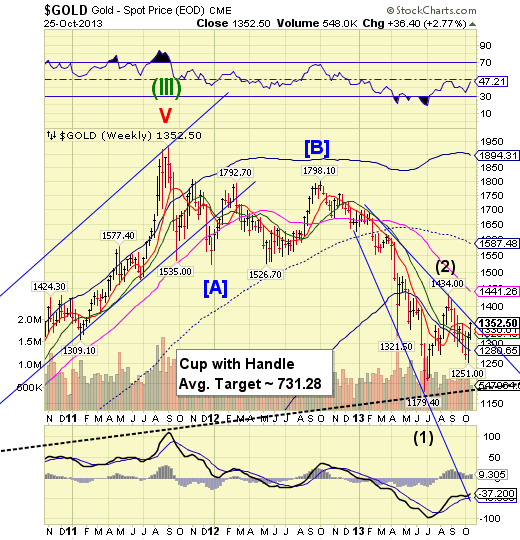
Gold continued its rally up to trendline resistance near 1360.00.If it breaks through, the next resistance may be Long-term resistance at 1441.26. Gold still holds considerable attraction for investors and it may provide a temporary “safe haven” for hot money. However, there is some evidence that the rally may be over. If so, this may be one of the shortest “recovery rallies” since mid-April.Gold may make a lot of people look foolish. (see below)
(ZeroHedge) Just two weeks after Goldman's "Slam Dunk Sell," report, the price of gold is surging once again. Goldman's Currie (in direct opposition to BofAML's Curry) argument that post debt-ceiling, "... with significant recovery in the U.S., tapering of QE should put downward pressure on gold prices," seems like another round of wishful thinking as physical premiums for gold around the world surge to record highs and spot prices reach one-month highs. Of course, while Goldman had a few days of positive reaction after their call, it is none other than Dennis Gartman who provided the bottom-tick in the latest exuberance.
Treasuries probe higher. 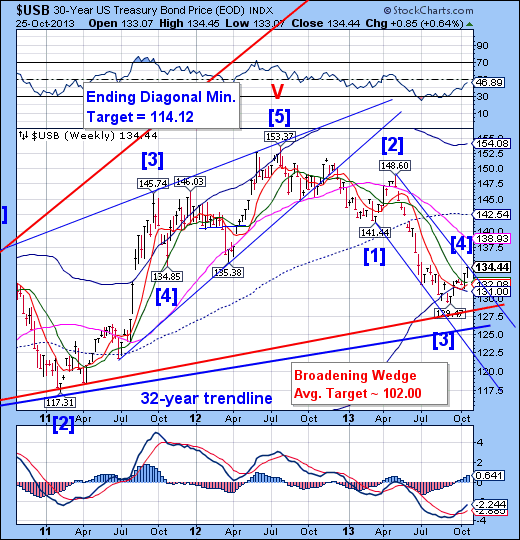
USB appears to have reached the top of its trend channel.If so, it may be due for a reversal beneath its Broadening Wedge and Ending Diagonal formations. There may be another day or two of testing the channel trendline, then USB has an appointment with an important low in mid-November.
(NASDAQ) U.S. Treasury bonds ended the week on a high note as the latest U.S. data releases raised concerns over economic growth and bolstered speculation the Federal Reserve would be in no rush to dial back its bond purchases.
In late-afternoon trading, the benchmark 10-year Treasury note was 4/32 higher, yielding 2.505%, according to Tradeweb. Bond prices rise when their yields fall.
The yield fell by about 0.09 percentage point this week. Treasury bonds have handed investors 0.5% in total return in October through Thursday, though they still suffered a 1.5% loss so far this year, according to Barclays.
Crudebounced at mid-Cycle support. 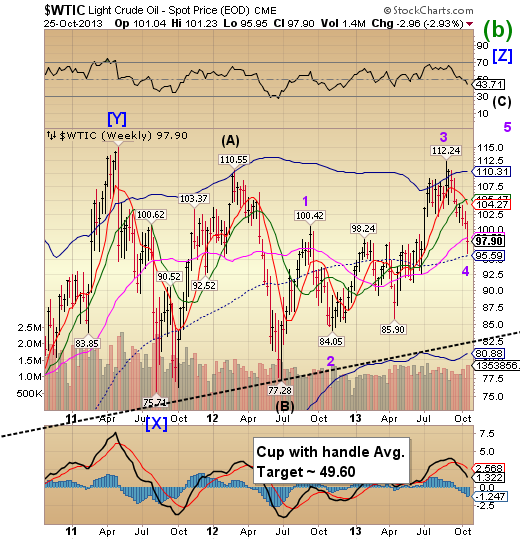
Crudemade a credible bounce at weekly mid-0cycle support this week. Should it gain ground above its Long-term support/resistance at 98.59, it may be able to complete the formation suggested on the chart.The Cycles Model suggests an important high may be coming around the last week of October or early November. If so, we could see crude priced near $125.00-130.00 by the end of the year.
China stocks lose critical support. 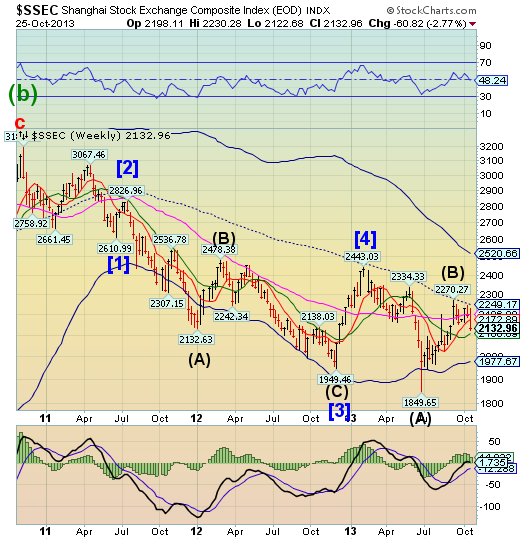
The Shanghai Index has now lost all but the weekly Intermediate-term support at 2106.08.It appears that the rally attempts are at an end. The Cycles Model suggests thedecline may extend through mid-November. Meanwhile, China’s biggest banks tripled the amount of bad loans written off in the first half, cleaning up their books ahead of what may be a fresh wave of defaults.
(ZeroHedge) The reason why the Chinese Shanghai Composite again can't catch a bid (and why the Baltic Dry is sliding and will continue sliding from recent highs) is the same as the main event yesterday: the concerns that while the Fed punchbowl is and will continue to be filled beyond the point of overflowing, China - where inflation has once again taken a turn for the worse as it did this summer when after much repo pain the PBOC killed it early on in order to not repeat the scary episode of 2011 - may be actively engaging in monetary tightening.
The India Niftyturns away from its Cycle Top.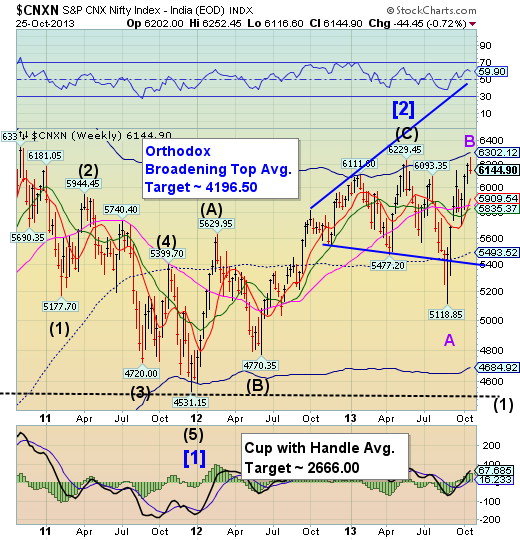
The India Nifty indexmay be making a very fast decline to its Cycle Bottom in short order.It has completed its final reversal and thetrigger to activate the Orthodox Broadening Top formation lies at the bottom trendline at 5400.00The probable target for Intermediate Wave (C) appears to be the Lip of the Cup with Handle near 4550.00.The decline from this top may be very fast.
(TheTimesofIndia) Identifying India as one of the five fragile economies of the world, a senior US official has predicted an uncertain outlook for its future in view of the next year's general elections."The big question about India now is what happens in the election next year and who will be the new government. That's a very complicated question," assistant treasury secretary for international finance Charles Collyns, said.
"India's the world's largest democracy. It has a multiple of political parties. There's one party on the right, the BJP, which would certainly try to push forward pretty aggressive reforms.
The Bank Indexgives back its gains. 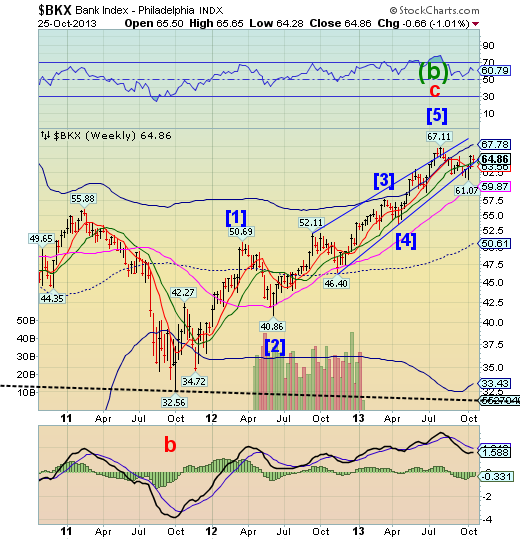
BKXhas given back some of its gains from the prior two weeks. It closed just above its support cluster from 63.56 to 64.37, but could easily lose that support. Aside from Lang-term support at 59.54, there is little to keep it from a 50% decline to its Cycle Bottom.
(ZeroHedge) In a tougher-than-expected proposal, the Fed has decided that "internationally active banks" raise their minimum liquidity standards (more than some expected, it would seem by the reaction in stocks).
(ZeroHedge) Across the board, we are seeing European bank stocks (most notably Italian) trading halted. The 5-7% plunge in prices - just when everyone is proclaiming victory in Europe - reflects an apparent concern that the tougher-than-expected European bank stress-tests will expose the Italian banks for the bloated sovereign debt issuance soaks that they have become. As Draghi himself noted, in a desperate plea to maintain some credibility "banks do need to fail" to prove the credibility of the exercise, adding "if they do have to fail, they have to fail. There’s no question about that."
- English (UK)
- English (India)
- English (Canada)
- English (Australia)
- English (South Africa)
- English (Philippines)
- English (Nigeria)
- Deutsch
- Español (España)
- Español (México)
- Français
- Italiano
- Nederlands
- Português (Portugal)
- Polski
- Português (Brasil)
- Русский
- Türkçe
- العربية
- Ελληνικά
- Svenska
- Suomi
- עברית
- 日本語
- 한국어
- 简体中文
- 繁體中文
- Bahasa Indonesia
- Bahasa Melayu
- ไทย
- Tiếng Việt
- हिंदी
Update: NYSE Margin Debt Rises To All-Time High
Published 10/28/2013, 01:31 AM
Updated 07/09/2023, 06:31 AM
Update: NYSE Margin Debt Rises To All-Time High
3rd party Ad. Not an offer or recommendation by Investing.com. See disclosure here or
remove ads
.
Latest comments
Install Our App
Risk Disclosure: Trading in financial instruments and/or cryptocurrencies involves high risks including the risk of losing some, or all, of your investment amount, and may not be suitable for all investors. Prices of cryptocurrencies are extremely volatile and may be affected by external factors such as financial, regulatory or political events. Trading on margin increases the financial risks.
Before deciding to trade in financial instrument or cryptocurrencies you should be fully informed of the risks and costs associated with trading the financial markets, carefully consider your investment objectives, level of experience, and risk appetite, and seek professional advice where needed.
Fusion Media would like to remind you that the data contained in this website is not necessarily real-time nor accurate. The data and prices on the website are not necessarily provided by any market or exchange, but may be provided by market makers, and so prices may not be accurate and may differ from the actual price at any given market, meaning prices are indicative and not appropriate for trading purposes. Fusion Media and any provider of the data contained in this website will not accept liability for any loss or damage as a result of your trading, or your reliance on the information contained within this website.
It is prohibited to use, store, reproduce, display, modify, transmit or distribute the data contained in this website without the explicit prior written permission of Fusion Media and/or the data provider. All intellectual property rights are reserved by the providers and/or the exchange providing the data contained in this website.
Fusion Media may be compensated by the advertisers that appear on the website, based on your interaction with the advertisements or advertisers.
© 2007-2024 - Fusion Media Limited. All Rights Reserved.
