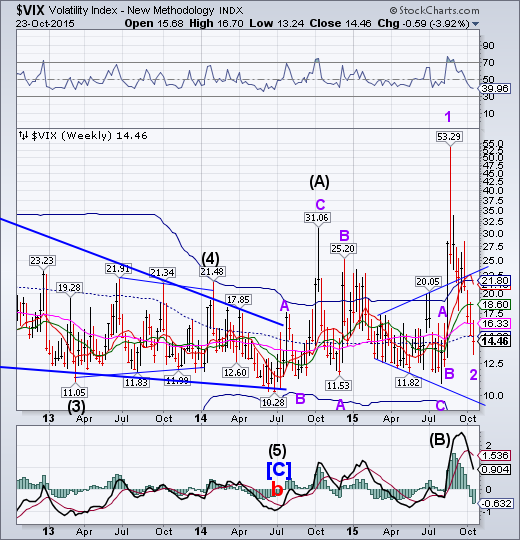
VIX closed beneath its weekly mid-Cycle support at 14.92 this week. The Broadening pattern calls for a throwback inside the Megaphone reaching mid-Cycle support. This pullback in the form of a cycle low extended beyond that point and is two weeks overdue. This is highly unusual for the month of October.
(ZeroHedge) On the basis of the fundamental economic backdrop, Goldman Sachs (N:GS) sees VIX fair-value at least 19, with low-teens more consistent with ISM in the upper 50s (not the current sub-50 levels). However, credit (and FX) protection markets imply significantly more risk ahead with CDX HY stalled at 2month lows (while VIX hits 3 month lows). Given historical relationships, credit markets suggest a VIX of 25 is more consistent with reality (especially as Skew tail risk rolls down to normal risk).
SPX “throws back” inside its Broadening top formation.
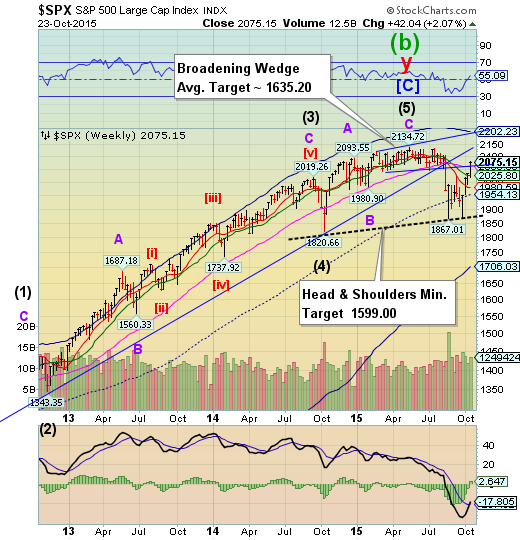
The SPX right Shoulder of its Head & Shoulders reached equality with the left shoulder at 2057.00 today. It also reached a 78.6% Fibonacci retracement at 2077.42 and threw back inside its Broadening Wedge formation, which was expected. This formation is activated by simply re-crossing the lower trendline at 2040.00. The Cycles Model calls for a potential retest of the lowswithin the next 2 weeks. A break of the trendline may lead to a flash crash.
(WSJ) A rally in the technology sector on Friday, spurred by upbeat earnings, propelled the S&P 500 back into positive territory for the year.
A further loosening of monetary policy in China and the prospect of more stimulus from the European Central Bank also fueled gains in global stocks.The S&P 500 rose 22.64 points, or 1.1%, to 2075.15, turning positive for 2015 for the first time since August.
NDX surges on earnings news, but no new high.
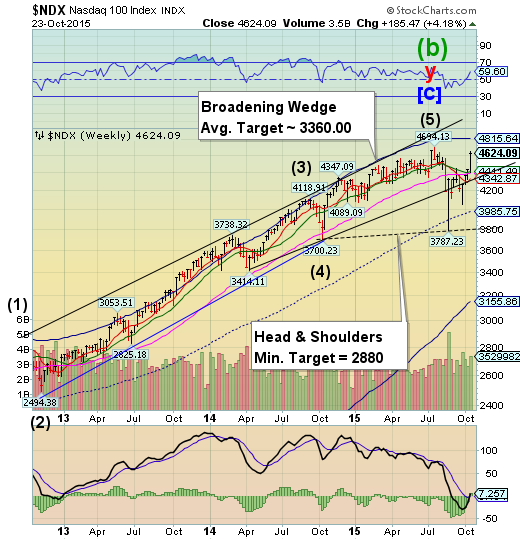
NDX surged on earnings news from tech companies. The July 20 high, however, is still unbeaten. A decline beneath the trendline at 4320.00 may trigger the Broadening Wedge formation. The next support beneath that is the August low and neckline.
(Reuters) Microsoft shares (O:MSFT) rose 10.1 percent to $52.87, their highest in 15 years, after adjusted revenue beat expectations for the ninth quarter in a row.
Microsoft gave the biggest boost to the three indexes, accounting for nearly a fifth of the Dow's gain and leading a strong rally in technology stocks. The S&P technology sector SPLRCT jumped 3.0 percent, leading gains among major sectors.
Alphabet, Google (O:GOOGL)'s new holding company, and Amazon (AMZN) soared to record intraday highs after results beat expectations. Alphabet ended up 5.6 percent at $719.33, while Amazon rose 6.2 percent to $599.03.
Facebook Inc. (O:FB) and Twitter (N:TWTR) also jumped, with Facebook rising above $100 for the first time.
High Yield Bonds retest a trendline.
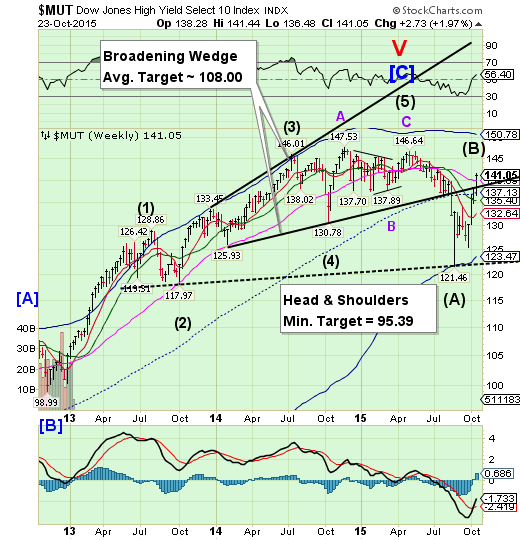
The High Yield Index “threw back” inside its Broadening Wedge formation, also nearly completing a Fibonacci 78.6% retracement. A drop back beneath the trendline may trigger the Broadening formation, leading to a potentially substantial decline. The Cycle Bottom/Head & Shoulders neckline may be challenged again. The Cycles Model suggests a major decline in HY over the next week or two.
(Reuters) Investors' growing confidence that the U.S. Federal Reserve will not raise interest rates this year prompted the biggest inflows into high yield bonds in eight months in the week to Oct 21, Bank of America Merrill Lynch (N:BAC) (BAML) said on Friday.
The search for yield meant that junk bonds attracted some $3.9 billion, with the view that rates will stay low for longer cemented by the European Central Bank striking a dovish tone on Thursday.
The Euro drops through all Model supports.
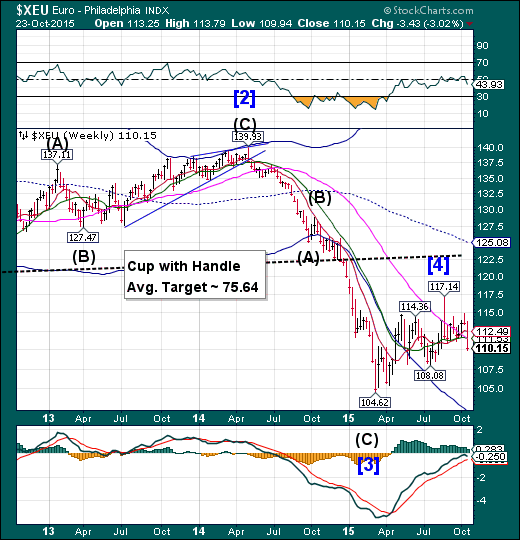
The euro followed last week’s reversal with a strong decline through all nearby supports. It is probable that the euro trend toward parity with the USD may be resuming shortly, as the next technical support lies at 102.13.
(CNBC) The prospect of the euro falling to equal the dollar has returned with a vengeance after the European Central Bank signaled on Thursday that it would consider extending its massive bond-buying program well into 2016 and even beyond.
Following the bank's decision to hold interest rates at record lows, ECB President Mario Draghi told a press conference that the "degree of policy accommodation will need to be re-examined in December" as inflation remains stubbornly low amid emerging market weakness.
This was widely interpreted as a sign that the bank's trillion euro ($1.1 trillion) quantitative easing (QE) program could either be expanded or extended beyond its original September 2016 deadline.
EuroStoxx rises to Long-term resistance.
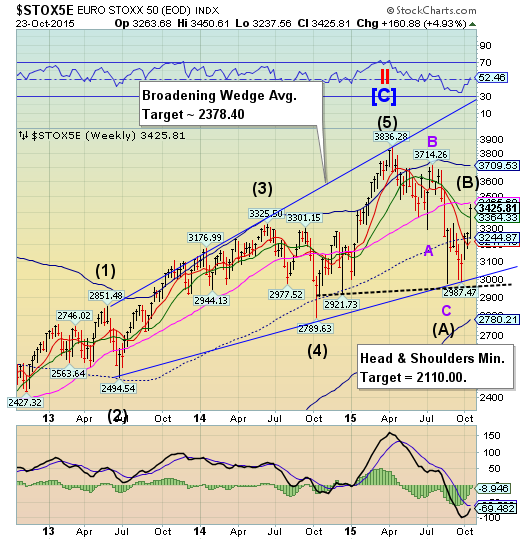
EuroStoxx 50 rose to weekly Long-term resistance at 3465.69. At this time, the Cycles Model suggests a potential decline lasting two weeks or more. A reversal here may cause a panic decline that may challenge the 2011-2012 lows.
(CNBC) European stocks rallied to close sharply higher Friday as investors cheered China's central bank as it cut interest rates again, while digesting a fresh set of corporate earnings.
The STOXX 600 shot up finishing provisionally 2 percent higher, with the German DAX soaring up 2.9 percent at the close.
Alongside China's rate cut, sentiment was buoyed after the European Central Bank (ECB) signaled willingness to extend its bond-buying program on Thursday.
The yen is testing support.
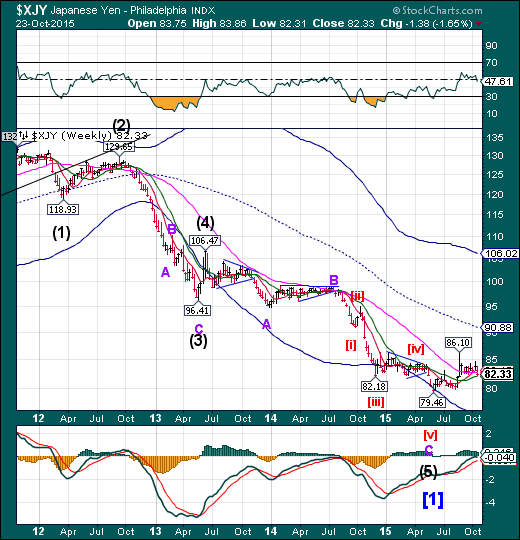
The yen dropped this week, challenging its Intermediate-term support at 82.12. A slip beneath support may impel the yen to decline over several weeks.
(Bloomberg) Whether or not the Federal Reserve raises interest rates this month, or even this year, Japan’s leveraged foreign-exchange investors are putting more money on the line than ever on expectations the yen will slide against the dollar.
Wagers from individuals for the Japanese currency to decline outnumbered bets it would gain by 614,623 contracts as of Oct. 13, the biggest net shorts since Tokyo Financial Exchange Inc.’s Click 365 began collecting the data in 2006. Those decisions may already be paying off with the yen weakening for six straight days to Thursday -- the longest run since a seven-day retreat to June 1 -- before the Federal Open Market Committee and Bank of Japan each decide policy next week.
The Nikkei stalls beneath Long-term resistance.
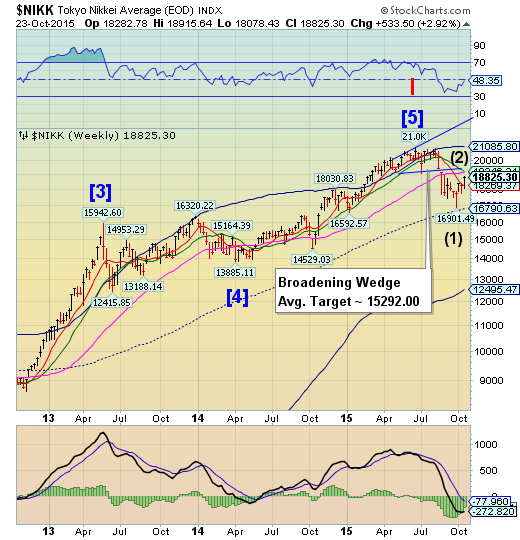
The Nikkei rallied, but fell short of Long-term resistance at 19157.26. A Trading cycle low appears to be due in two weeks. Should the decline go beneath mid-cycle support at 16790.63, the Nikkei may experience a flash crash.
(Reuters) - Japan's Nikkei share average rose sharply to a near two-month high on Friday after European Central Bank President Mario Draghi signaled that new stimulus measures could come as early as December, boosting riskier assets.
The Nikkei jumped 2.3 percent to 18,858.43 points by midmorning after rising to as much as 18,886.75, the highest since Aug. 31.
For the week, the Nikkei looked set for a gain of 3.0 percent.
U.S. dollar breaks above its Diamond formation.
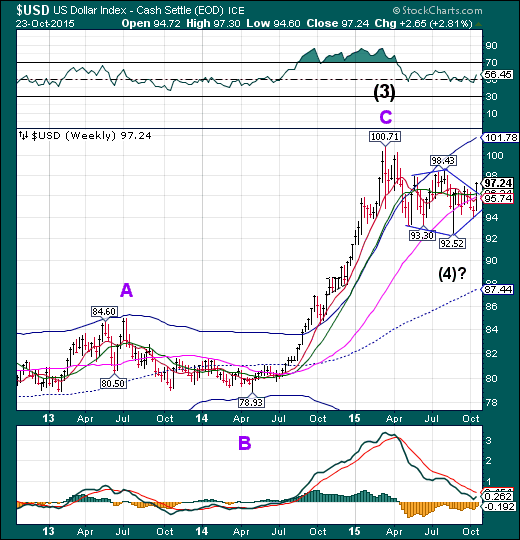
The US dollar broke above its irregular-shaped Diamond formation as suggested last week. The Diamond formation appears as a reversal pattern, since it had been making successively lower lows. Others see this formation as a Flag. Both patterns are bullish and potentially reliable.
(Reuters) Speculators pared back bullish bets on the U.S. dollar in the latest week, with net longs falling to their lowest in 15 months, according to Reuters calculations and data from the Commodity Futures Trading Commission released on Friday.
The value of the dollar's net long position dropped to $13.32 billion in the week ended Oct. 20, from $18.97 billion the week before. That was the smallest net long position since mid-July 2014 and the third straight week speculators have reduced long contracts on the dollar.
To be long a currency is to make a bet it will rise, while being short is a bet its value will decline.
USB resumes its rally.
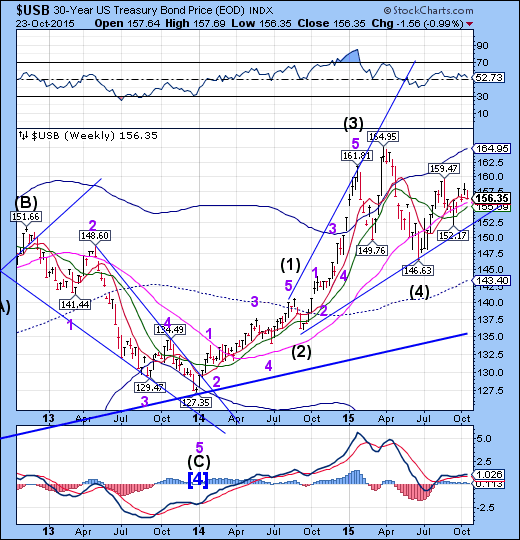
The Long Bond closed above Short-term support at 156.26 this week as it made a minor Trading Cycle bottom on Friday. The trend is for higher prices, but we must see a breakout above 159.47 to confirm the trend. It is soon likely that the rally may resume towards its Cycle Top at 164.95 near the end of the month.
(WSJ) China’s interest-rate cuts Friday sparked the biggest one-day selloff in three weeks in the U.S. government debt market as global stocks rallied.
The news came one day after the European Central Bank signaled its willingness to expand monetary stimulus in coming months. Investors expect the Federal Reserve to hold short-term interest rates near zero next week. And speculation has been growing that the Bank of Japan, at its policy meeting at the end of this month, could pump more cash into its economy.
Taken together, the highly accommodative monetary policy backdrop has allayed some fear over the flagging global growth outlook and sapped demand for ultrasafe Treasury debt.
Gold is repelled at Long-term resistance.
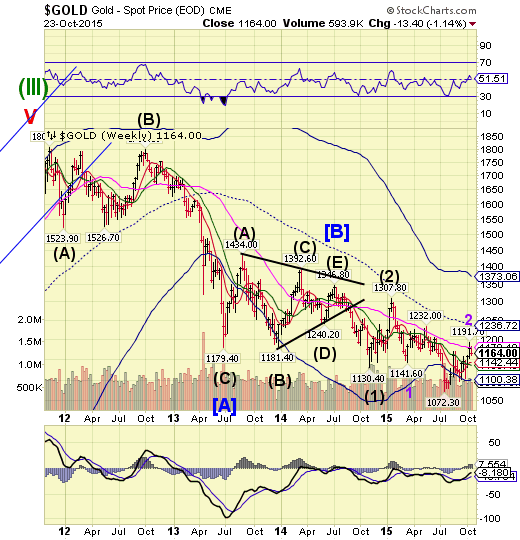
Gold began its decline after meeting opposition from weekly Long-term resistance at 1178.18. A confirmed reversal may portend up to five weeks of decline.
(MarketRealist) We’ve seen the yellow bullion recover, leaving the price almost flat over the 2015 calendar year. Goldman Sachs has commented on the gold outlook for the rest of the year. Gold has increased 3.3% on a 30-day trailing basis. Silver, platinum, and palladium have seen a rise in prices of 7.4%, 8.6%, and 6.4%, respectively.
Goldman warns investors against the revival of bullion prices and suggests pessimism. In an interview with Bloomberg on Tuesday, October 20, 2015, Jeffrey Currie of Goldman Sachs said, “With the more positive outlook on the dollar, and with debasement risk starting to fade, the demand to use gold as a diversifying asset against the U.S. dollar becomes less and less important.” He added, “There is a probability that the market trades below $1,000 this year given our broader commodity view.”
Crude approaches the bottom of its Triangle.
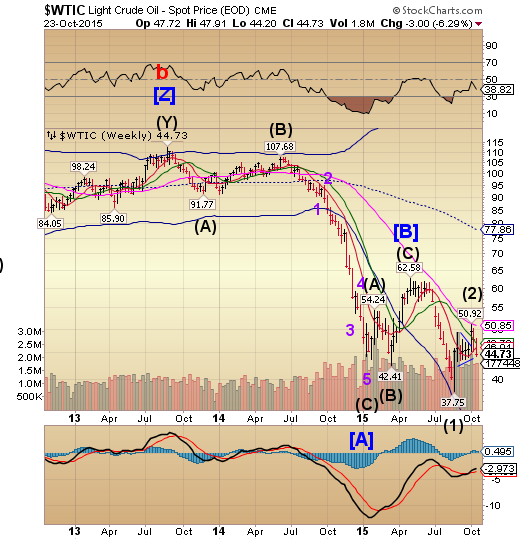
Crude appears to be about to break out below its Triangle formation. The Cycles Model suggests an overdue Master Cycle low may arrive by the end of next week. The issue seems to be the lack of support beneath its August low at 37.75. A breach of that level would have serious consequences.
(WSJ) Oil prices slipped Friday as the dollar surged after China introduced new stimulus measures to boost its flagging economy.
The benchmark U.S. crude contract ended down 78 cents, or 1.7%, at $44.60 a barrel on the New York Mercantile Exchange, settling back below $45 for the first time since Oct. 1. Prices have now lost 10% from their peak earlier in the month. The global Brent benchmark finished down 9 cents, or 0.2%, at $47.99 a barrel on the ICE Futures Europe exchange.
Shanghai Index stalls beneath resistance.
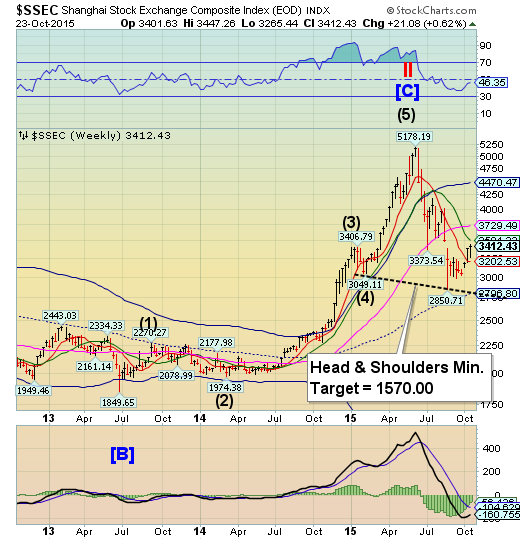
The Shanghai Index stalled beneath its Intermediate-term resistance at 3501.33. The Cycles Model suggests today may be a Pivot high, with a subsequent decline lasting the next two weeks.
(Reuters) China stocks rose more than 1 percent on Friday after President Xi Jinping said the economy will not suffer a hard landing, and as home price data suggested a mild recovery in the Chinese property market.
The CSI 300 index of the largest listed companies in Shanghai and Shenzhen and the Shanghai Composite Index both rose around 1.3 percent to 3,571.24 points and 3,412.43 points, respectively.
Both indices rose for the third week in a row, with the CSI300 up 1.1 percent and the SSEC 0.6 percent
The Banking Index stalls short of Long-term resistance.
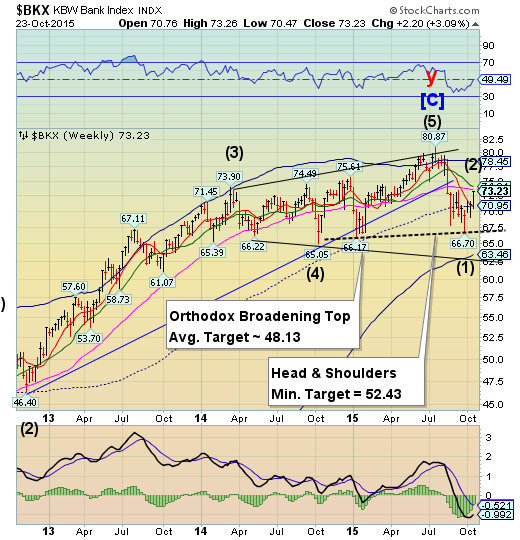
BKX appears to have stalled short of Long-term resistance at 73.62 and has completed less than a 50% retracement. A resumption of weakness may lead to a retest of the lows over the next two weeks.
(24/7WallSt) While the U.S. Federal Reserve Bank seems content to hold interest rates “lower for longer,” U.S. banks are not as happy. The longer the Fed keeps interest rates low, the tighter the squeeze on the banks’ profits.
In a new report published Friday, Fitch Ratings says that banks will continue to focus on controlling costs and improving operating efficiencies in their battle to beef up margins until the Fed raises short-term lending rates.
According to the Fitch analysts, bank margins fell to 3.02% in the first quarter of this year, the lowest average net interest margin (NIM) since 1984. Fitch analysts go on:
The vast majority of the banks within Fitch’s rating universe continue to disclose that they are asset-sensitive, meaning when rates rise, so does net interest income, as assets reprice faster than liabilities. However, many asset-sensitivity disclosures assume a 100-bps or 200-bps parallel increase in rates. Thus, a very gradual rate rise coupled with longer term rates remaining stable would make it unlikely for many US banks to see any meaningful NIM improvement over the near to immediate term.
(WSJ) Some Swiss banks loaded funds onto untraceable debit cards. At another, clients who wanted to transfer cash used code phrases such as “Can you download some tunes for us?” One bank allowed a client to convert Swiss francs into gold, which was then stored in a relative’s safe-deposit box.
Dozens of Swiss banks have been spilling their secrets this year as to how they encouraged U.S. clients to hide money abroad, part of a Justice Department program that lets them avoid prosecution. It is part of a broader U.S. crackdown on undeclared offshore accounts that has ensnared big Swiss banks such as UBS Group AG (N:UBS), but has received scant attention because it mostly involves little-known firms and relatively small fines.
(Reuters) - The controversy surrounding Valeant Pharmaceuticals (N:VRX)' strategy and its market slide this week are bad news for Wall Street investment banks that stand to lose one of their best clients.
The specialty drug company has emerged as the fifth-largest payer of investment banker fees over the past three years thanks to its rapid acquisition-driven and debt-financed expansion that has made it a darling of investors.
But its business model, which has also relied on aggressive price hikes for acquired drugs, has come under growing scrutiny because of political backlash against high drug prices, dragging
