
Equities
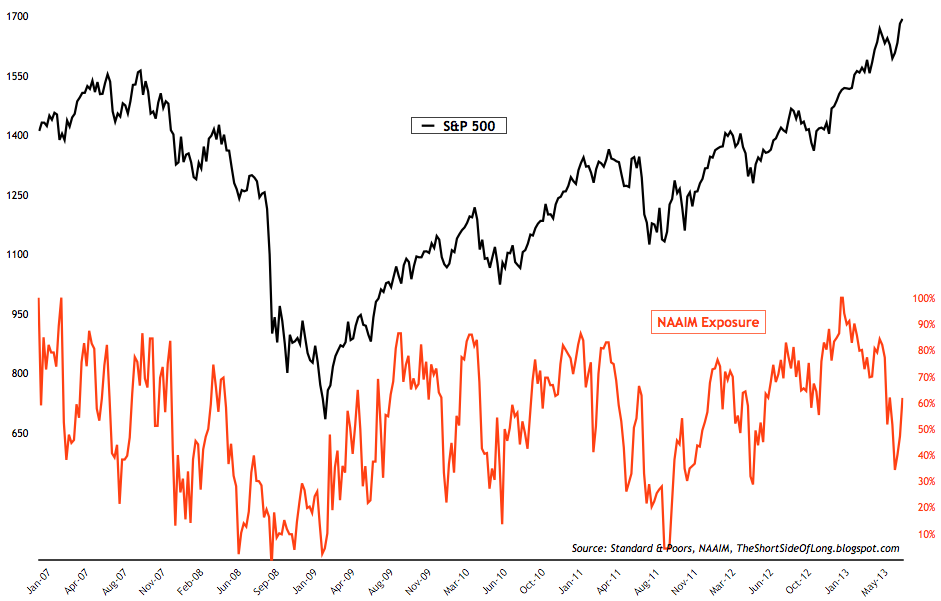
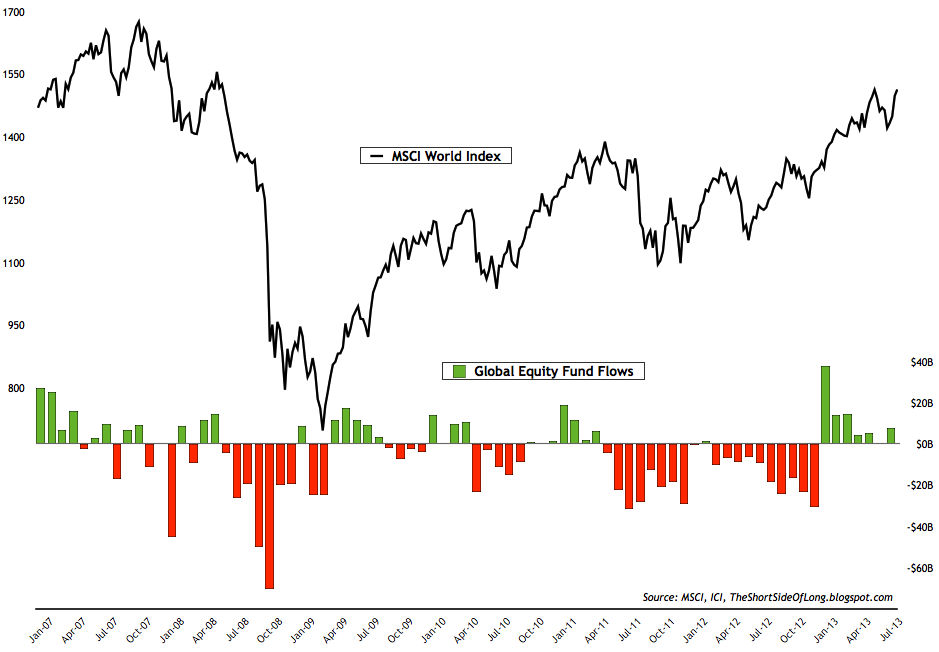
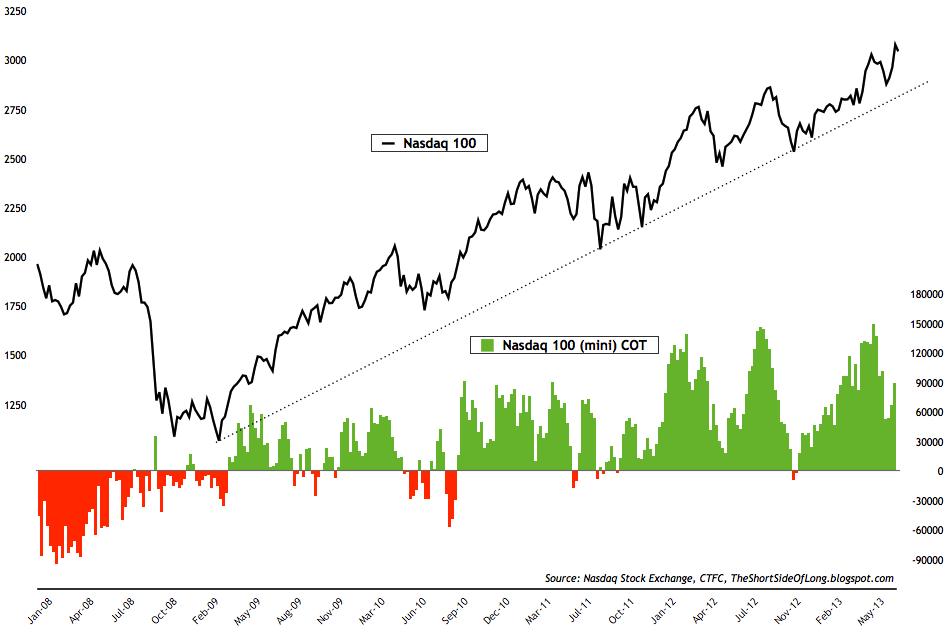
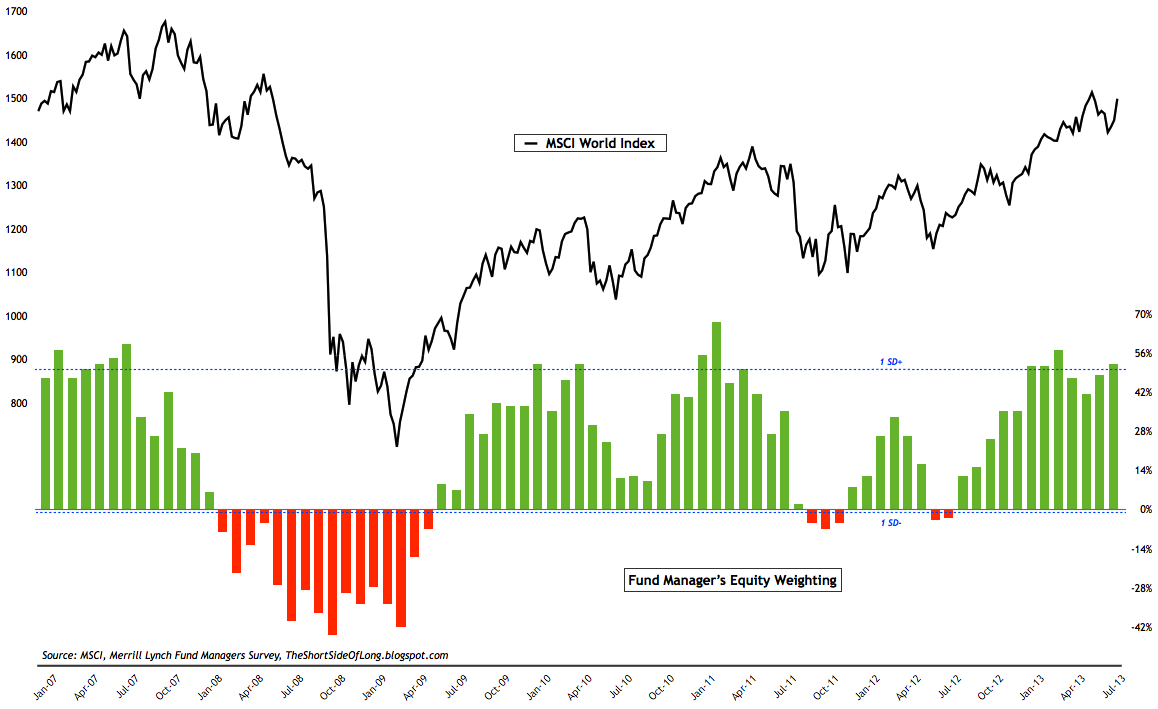
Chart 5: Bond Consensus survey shows investors are extremely pessimistic
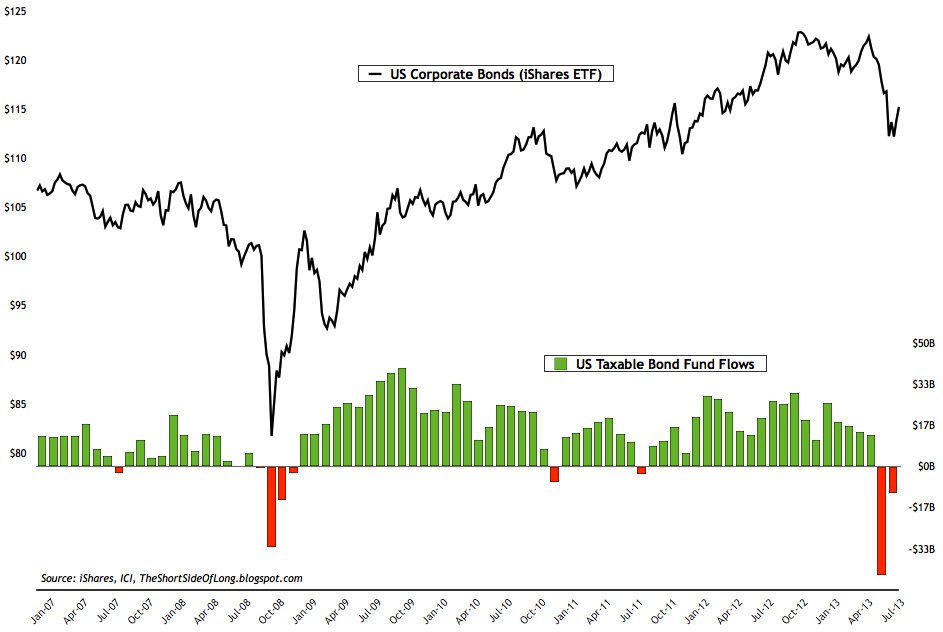
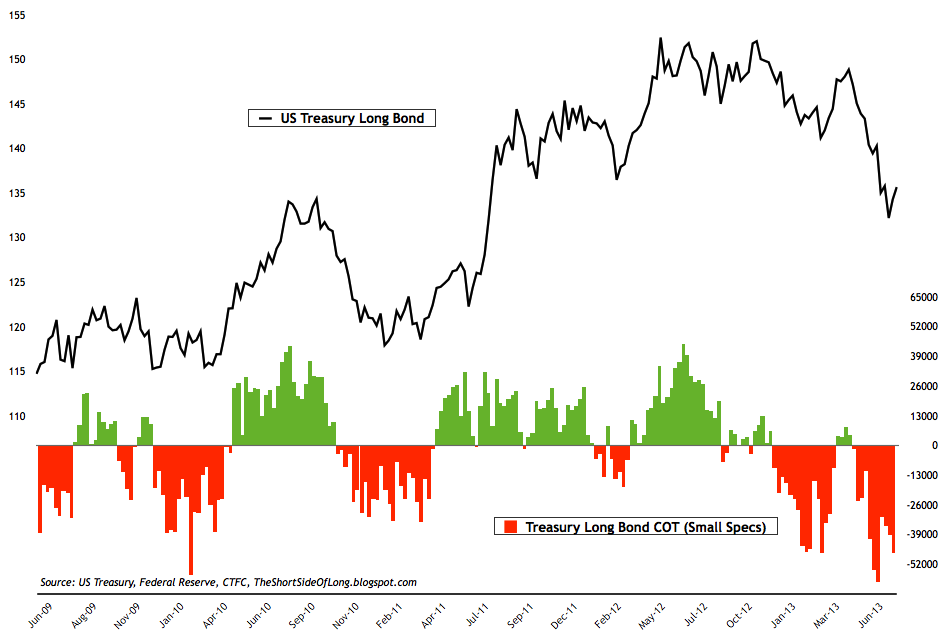
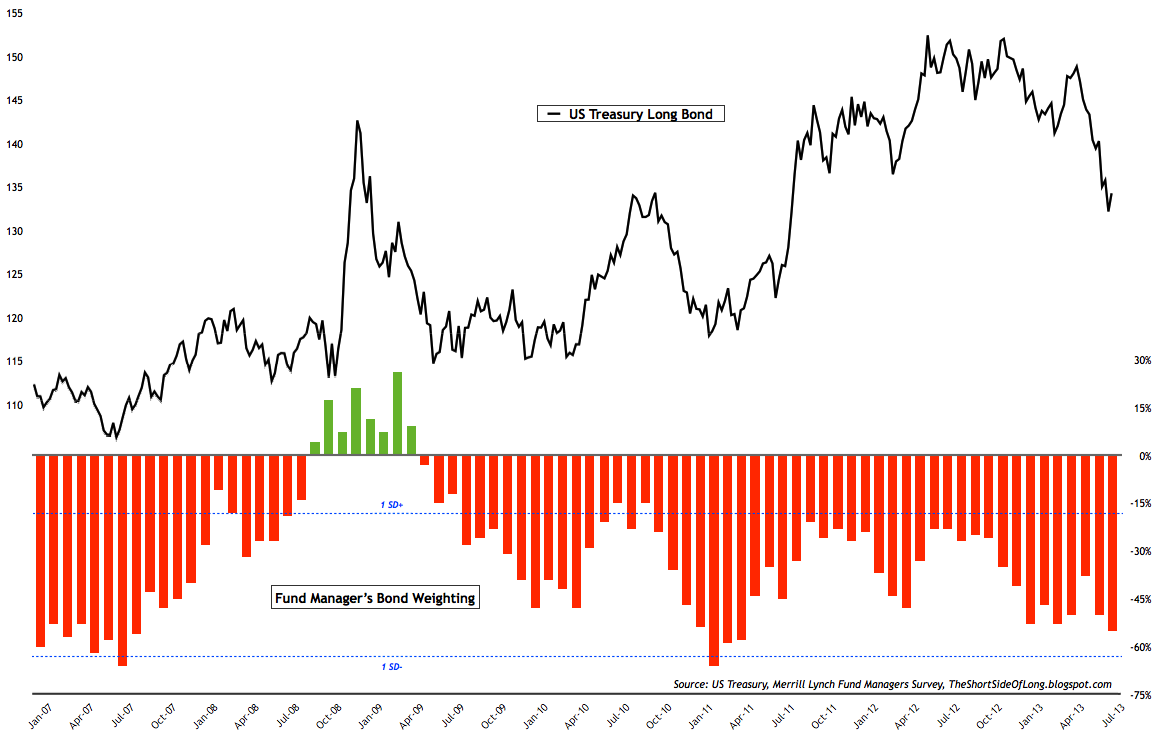
Chart 9: Funds continue to dramatically cut their commodity exposure
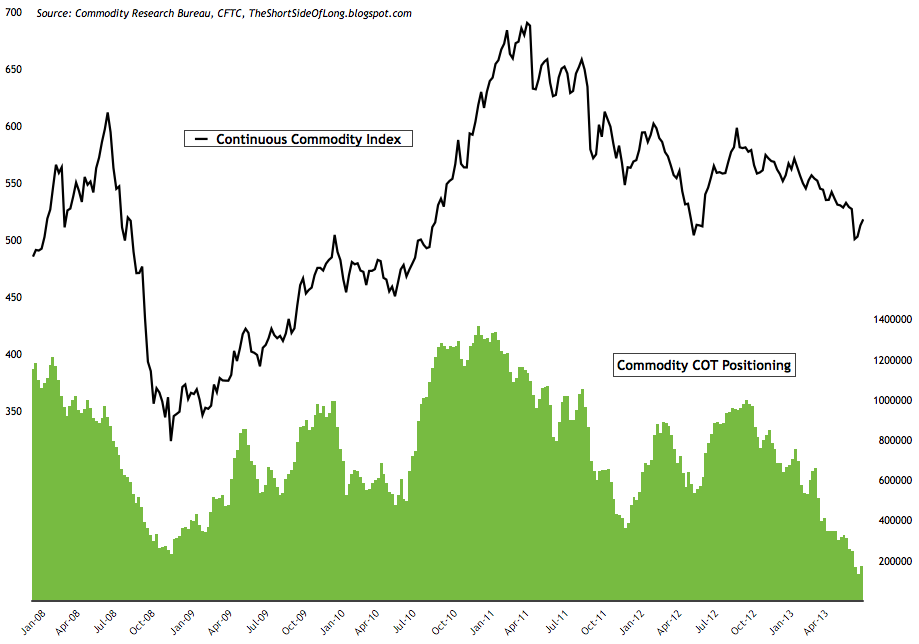
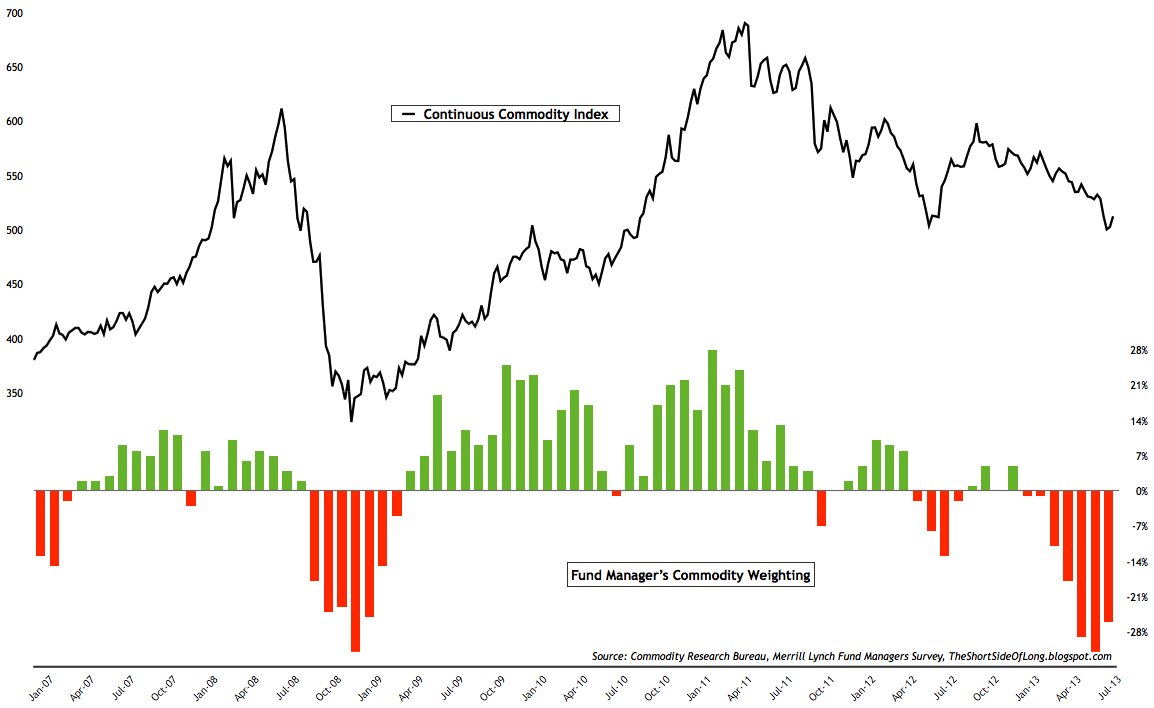
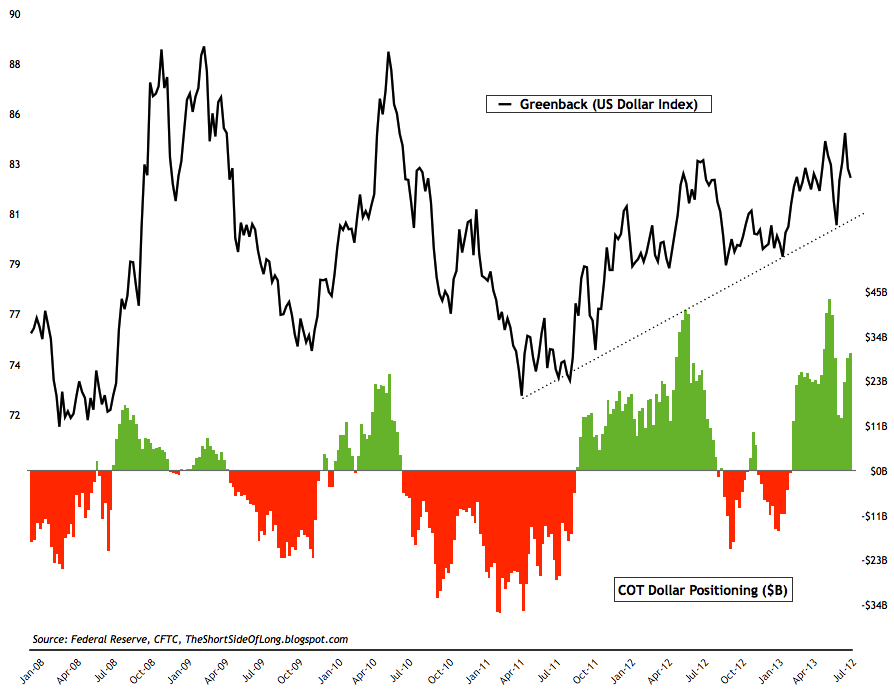
Chart 11: Hedge funds are building bullish greenback bets again
- AAII survey readings came in at 48% bulls and 21% bears. Bullish readings fell by 1% while bearish readings rose by 3%. The AAII bull ratio currently stands at 70%, which still indicates extreme optimism amongst the retail investment community (on going from last week).
- Investor Intelligence survey levels came in at 52% bulls and 20% bears. Bullish readings rose by 5%, while bearish readings also fell by 3%. II bull ratio once again re-enetred a "sell signal" territory.
- NAAIM survey levels came in at 62% net long exposure, while the intensity fell dramatically towards -17%. The chart above shows that during the recent correction, managers did reduce their positioning, but we never reached a true contrarian "buy signal". For that to occur, we will need to see exposure reach 0% or even fall towards negatives (seen in October 2008 and October 2011).
- Other sentiment surveys have once again started rebounding back towards extreme optimistic levels, giving us a "sell signal". Consensus Inc survey is once again rising, while Market Vane survey has now entered extremely bullish level with a reading of 66% bulls (market recently topped with 70% bulls). As already stated last week, not one sentiment survey indicator I track has approached a worthy contrarian "buy signals" during the recent pull back.
- Last weeks ICI fund flows report showed "equity funds had estimated inflows of $7.60 billion for the week, compared to estimated inflows of $246 million in the previous week. Domestic equity funds had estimated inflows of $4.55 billion, while estimated inflows to world equity funds were $3.05 billion." The chart above shows that over the last 7 months, retail investors have been piling into global equity funds. This usually tends to occur near the end of the rallies, similar to early 2010, early 2011 and now in mid 2013. Rydex fund flows remain at similar levels to what I discussed last week. As already stated previously, a long term buy signal only occurs when Nova Ursa ratio drops as low as 10 (like in March 2009, July 2010 and October 2011).
- Last weeks commitment of traders report showed that hedge funds and other speculators increased their bets substantially from the previous weeks readings. Net long positions held on the US tech equities (Nasdaq 100) have now risen to 89,000 bets from low 67,000 last week. We have not yet reaching extremes on either end of the scale, but are definitely moving towards a bullish bias once again.
- According to the recent monthly Merrill Lynch Fund Manager Survey, equity exposure was increased to 52%, which is more then 1 standard deviation above the mean (chart above). However, not all equities are liked. Managers hold the biggest overweight positioning in the US and Japan (29% and 27% overweight respectively), and the biggest underweight in the emerging markets. As a matter of fact, at -18% underweight, GEMs are now at historical record underweight according to Merrill Lynch.
Chart 5: Bond Consensus survey shows investors are extremely pessimistic
- Bond sentiment surveys are nearing pessimistic territory as already discussed in previous posts. Market Vane survey & Hulbert Newsletter Bond survey are turning more negative but are not yet at the panic levels, while Consensus Inc survey, shown in the chart above, has now reached extreme downside levels with only 24% bulls. For a longer term investor like myself, bonds remain extremely overvalued after a 31 year bull market. However, for traders, the question is weather or not this is a good opportunity to buy bonds as a trade?
- Last weeks ICI fund flows report showed "bond funds had estimated outflows of $8.10 billion, compared to estimated outflows of $5.98 billion during the previous week. Taxable bond funds saw estimated outflows of $5.73 billion, while municipal bond funds had estimated outflows of $2.38 billion." Retail investors continue to panic sell out of the bond market. All debt maturity and all grades have been affected by the recent price volatility, but while the outflows have continued investment grade bonds have quickly doubled bottomed and bounced rather sharply.
- Last weeks commitment of traders report shows that small speculators remain net short the Treasury Long Bond market with over 47,000 net short contracts, an increase of 7,000 contracts from last week. We are now approaching an extreme level of 50,000 net short bets, which usually signals intermediate degree bottoms with other sentiment surveys confirming this view.
- According to the recent monthly Merrill Lynch Fund Manager Survey, bond exposure was reduced to -55%, which is slowly but surely approaching 1 standard deviation below the mean (chart above). When we take into consideration equity exposure discussed above, relative to bond exposure discussed here, we can see that bonds are extremely underweighted relative to stocks.
Chart 9: Funds continue to dramatically cut their commodity exposure
- Last weeks commitment of traders report showed that hedge funds and other speculators increased commodity net long bets for the first time in weeks. Cumulative net long exposure increased to 170,000 net longs, from previous weeks reading of decade low 132,000 contracts (custom COT aggregate). Exposure was reduced in Soft agriculture once again, while it was increased in all other sectors - Energy, Metals and Grain agriculture.
- Commodity Public Opinion surveys are mixed within the commodity complex. As energy rallies, sentiment has risen above neutral levels. On the other hand, agricultural commodities and metals still remain under pressure. Sentiment on base metals and precious metals, as well as soft commodities like Cocoa, Coffee and Sugar are all in extreme unloved territory.
- According to the recent monthly Merrill Lynch Fund Manager Survey, commodity exposure improved from record low underweight, but still remains over 2 standard deviation below the mean (chart above). Commodity exposure improved from -32% underweight last month, towards -26% underweight this month. Commodity underexposure goes hand in hand with GEMs equity bearishness and worries of Chinese hard landing. This has now become a major consensus trade.
Chart 11: Hedge funds are building bullish greenback bets again
- Last weeks commitment of traders report showed growing exposure towards the US Dollar increased once again from the previous weeks readings. Cumulative positioning by hedge funds and various other speculators stands very close to $30 billon, compared to $28 billion last week and $13 billion during late June. Hedge funds hold short bets against all foreign currencies from Euro and Yen all the way to Aussie Dollar, where positioning remains near record high net shorts. Finally, Merrill Lynch Fund Managers Survey reported that 83% expect the dollar to rise in value over then next 12 months (the largest ever bullish view for the survey).
- Currency Public Opinion survey readings on the US Dollar reverted back toward s the mean after the recent US Dollar correction. At the same time, Public Opinion on the foreign currencies has bounced slightly from the extremely pessimistic readings we saw a couple of weeks ago. In particular, investors continue to dislike the Euro, with sentiment reading depressed not only for weeks, but for years.
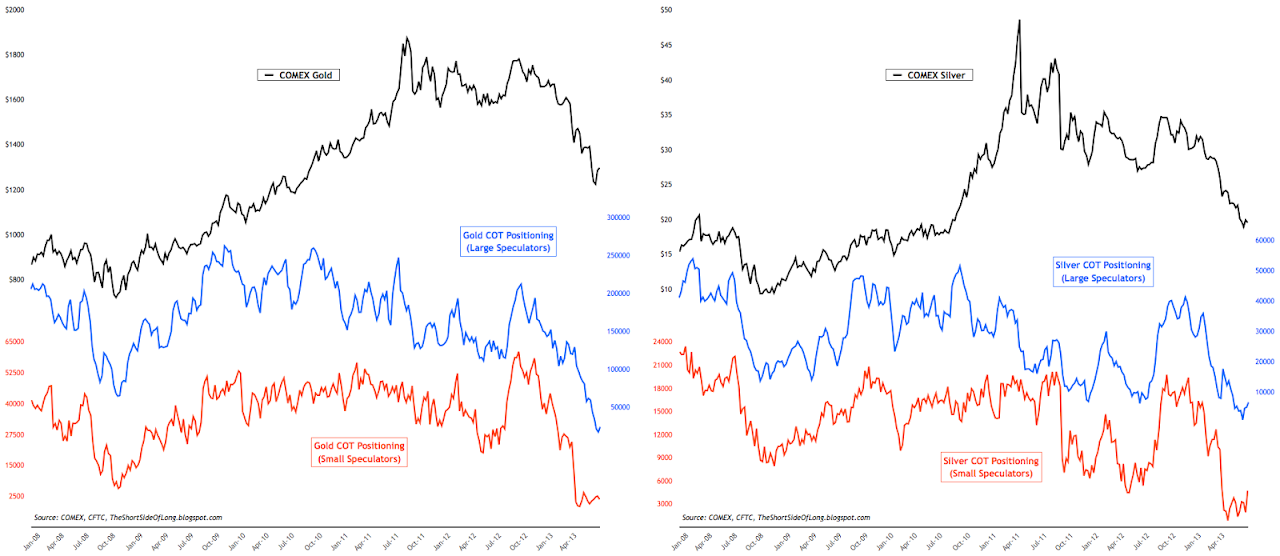
- Last weeks commitment of traders report showed hedge funds and other speculators have started to add some exposure back to the precious metal sector. Hedge fund positions on Gold increased to 23,5000 from last weeks 16,500 net longs. In Silver, hedge funds and other speculators increased bets to over 6,500 net longs. Nevertheless, as a percentage of open interest, both Gold and Silver positioning remains in single digits, giving us a "buy signal".
- Public opinion on alternative currencies like Gold and Silver still continues to remain depressed, which is confirming the ultra bearish COT reports discussed above. Bear market is still in progress but there are signs that we are finally bottoming out.
3rd party Ad. Not an offer or recommendation by Investing.com. See disclosure here or
remove ads
.