
Equities
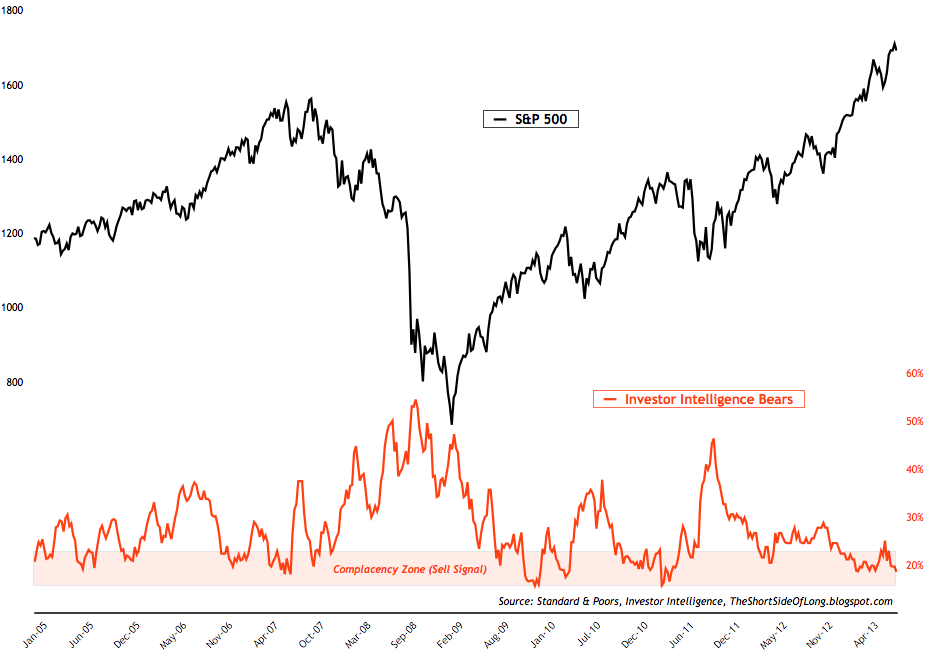
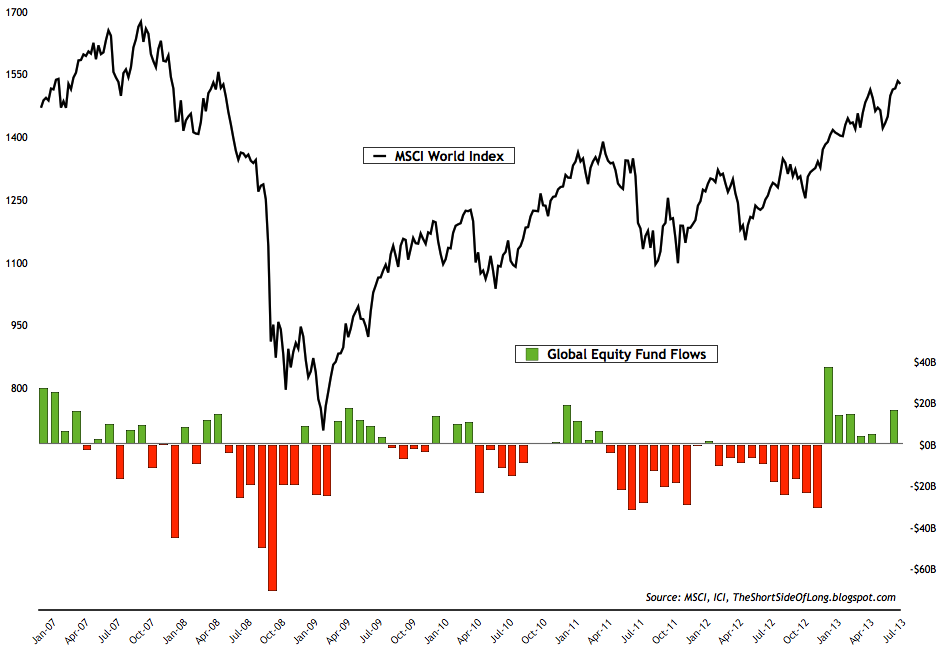
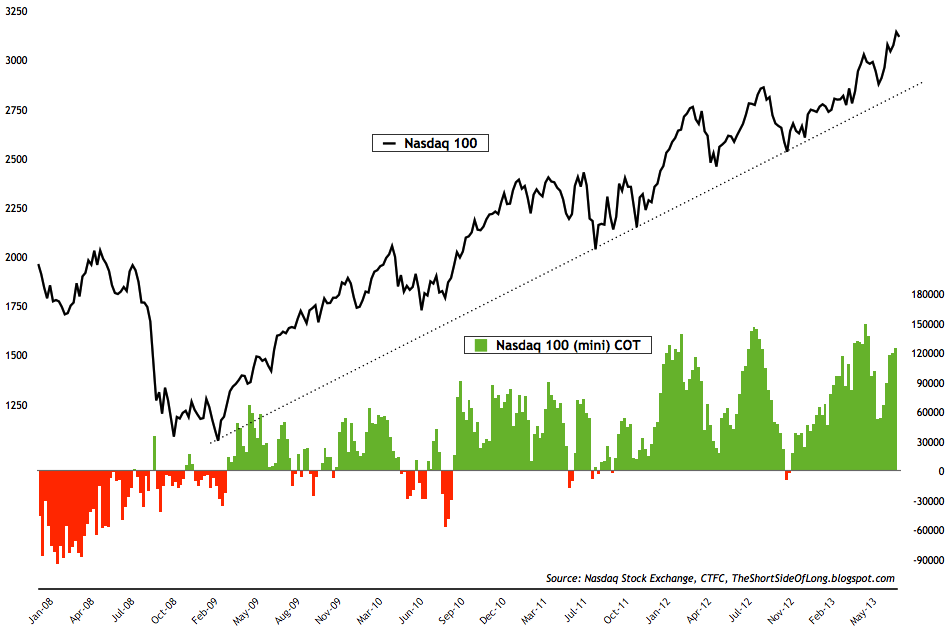
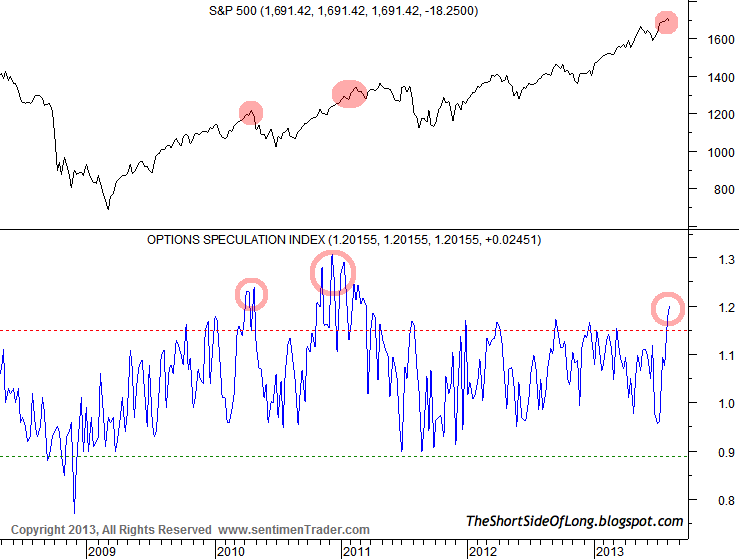
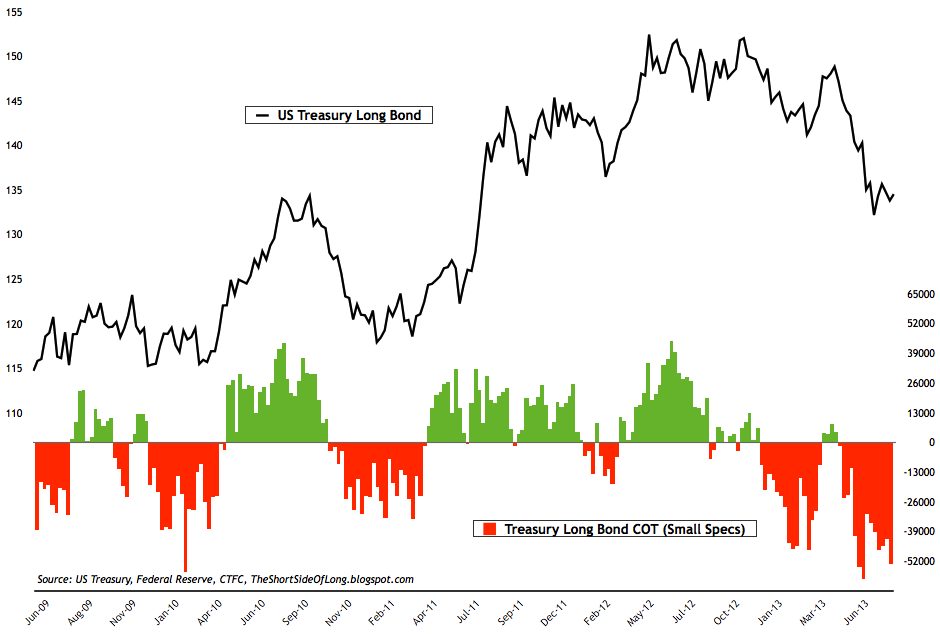
Chart 6: Fund exposure to commodities still remains depressed...
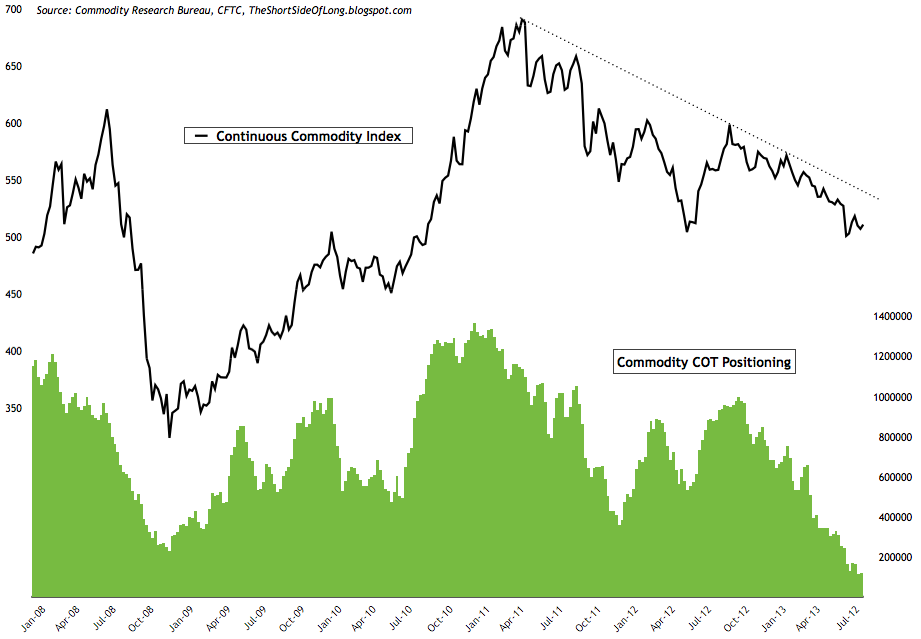
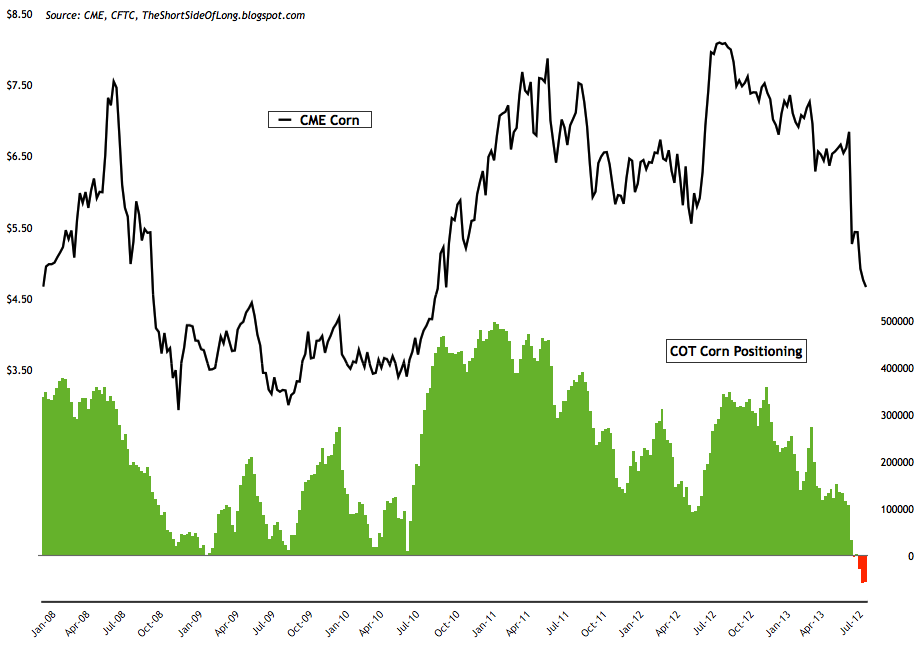
Chart 8:
- AAII survey readings came in at 40% bulls and 27% bears. Bullish readings fell by 4% while bearish readings rose by 2%. The AAII bull ratio (4 week average) currently stands at 64%, which indicates very high optimism amongst the retail investment community. For referencing, AAII bull ratio survey chart can been seen by clicking here, while AAII Cash Allocation survey chart can be seen by clicking here.
- Investor Intelligence survey levels came in at 52% bulls and 19% bears. Bullish readings increased by 3%, while bearish readings fell by 1%. Bearish readings have now fallen to the lowest level since early 2011 as equity market was in the process of a major top and a 20% sell off. Furthermore, II bull ratio remains above 73% a serious "sell signal" territory that traders and investors alike should consider. For referencing, II bull ratio survey chart can been seen by clicking here.
- NAAIM survey levels came in at 76% net long exposure, while the intensity fell to 130%. the recovery in sentiment by fund managers, seen in this survey, now lines up with the mood of the remain survey indicators. For referencing, recent NAAIM survey chart can been seen by clicking here.
- Other sentiment surveys continue to rise towards extreme optimism. However, the movement has been rather mute in recent weeks. Consensus Inc survey is still rising towards extreme territory, while Market Vane survey is on a cusp of it too. All in all, nothing new to report here.
- Last weeks ICI fund flows report showed "equity funds had estimated inflows of $714 million for the week, compared to estimated inflows of $4.20 billion in the previous week. Domestic equity funds had estimated outflows of $926 million, while estimated inflows to world equity funds were $1.64 billion." The chart above shows that retail investment community continues to pile into stocks this late in the rally (S&P is up over 55% from October 11 lows). Rydex fund flows are also rising too. Recent data showed that leveraged funds (usually not featured here) showed 6 times more bullish inflows relative to bearish funds. That is the hgihest reading for the bull market since it began in March 09. For referencing, recent Rydex fund flow chart can be seen by clicking clicking here.
- Last weeks commitment of traders report showed that hedge funds and other speculators continue to increase their bullish bets, once again edging closer to record extremes. Net long positions now stand at 124,500 contracts, relative to previous readings of 120,000 contracts. Exposure is now at extreme levels, which is usually associated with market corrections.
- Speculation in the options market has risen towards the highest levels since early 2011, just as the stock market was topping. Jason Goepfert from SentimenTrader (highly recommend service) recently wrote that "traders placed a large emphasis on bullish options strategies last week. Opening transactions were the most aggressively skewed in nearly a year." Chart above confirms that the calls relative to puts continue to increase.
- Bond sentiment surveys have not experienced much change in recent weeks either. Market Vane survey is approaching levels of pessimism, while Consensus Inc survey is at extreme readings usually associated with tradable opportunities. For referencing, recent Consensus Inc survey chart can be seen by clicking here.
- Last weeks ICI fund flows report showed "bond funds had estimated outflows of $6.94 billion, compared to estimated inflows of $2.16 billion during the previous week. Taxable bond funds saw estimated outflows of $4.07 billion, while municipal bond funds had estimated outflows of $2.87 billion." Another major outflow week for bonds, as the retail investment community switches over from bonds into stocks. However, this late in the rally, stocks are overvalued and bonds have recently become extremely oversold. The contrarian play would be to do the opposite of the public. For referencing, recent ICI bond fund flow chart can be seen by clicking here.
- Last weeks commitment of traders report shows that small speculators increased net short bets dramatically on the Treasury Long Bond. Current readings now stand at -53,500 net short contracts, which is one of the most extreme bearish bets in years (since early 2010). It is worth mentioning that by March 2010, Treasury Bonds went on a multi month rally, squeezing all the bears.
Chart 6: Fund exposure to commodities still remains depressed...
- Last weeks commitment of traders report showed that hedge funds and other speculators remain relatively neutral in their weekly change of contract exposure. Cumulative net longs currently stand at 121,000 contracts (custom COT aggregate) and remains well below December 2008 and July 2012 (both marked intermediate degree bottoms).
- Exposure continues to be reduced in the agricultural sector, with hedge funds and other speculators continuing to hold large net short bets on Corn (chart above). Majority of the other agricultural commodities show that hedge funds remain very pessimistic on future prospects and their hold either reduced longs or net shorts (e.g. Sugar, Coffee, Wheat, Soybeans and so forth).
- Commodity Public Opinion surveys still remain mixed within the commodity complex. As energy rallies, sentiment has risen above neutral levels. On the other hand, agricultural commodities and metals still remain under pressure. Sentiment on metals and soft commodities is unloved territory. For referencing, recent Sugar Public Opinion survey chart can be seen by clicking here.
Chart 8:
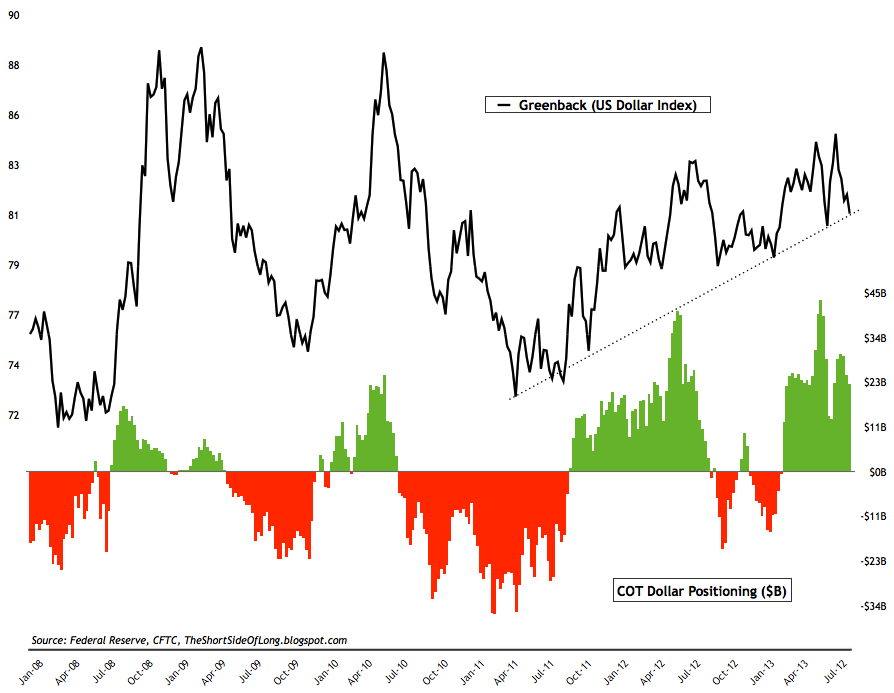
- Last weeks commitment of traders report showed a another weekly reduction in net long exposure towards the US Dollar. Cumulative positioning by hedge funds and other speculators stands slightly higher than $22 billion. Investors should note that hedge funds still hold short bets against almost all foreign currencies including, apart from the Euro where net longs are finally present. Aussie Dollar bets have reached record highs... again. Technically, the chart above shows that the US Dollar price action is testing the 2 year rising trend line.
- Currency Public Opinion survey readings on the US Dollar reverted back towards the mean after the recent US Dollar correction. At the same time, Public Opinion on the foreign currencies has bounced from the extremely pessimistic readings we saw a few weeks ago. All in all, nothing major to report here, just like last week.
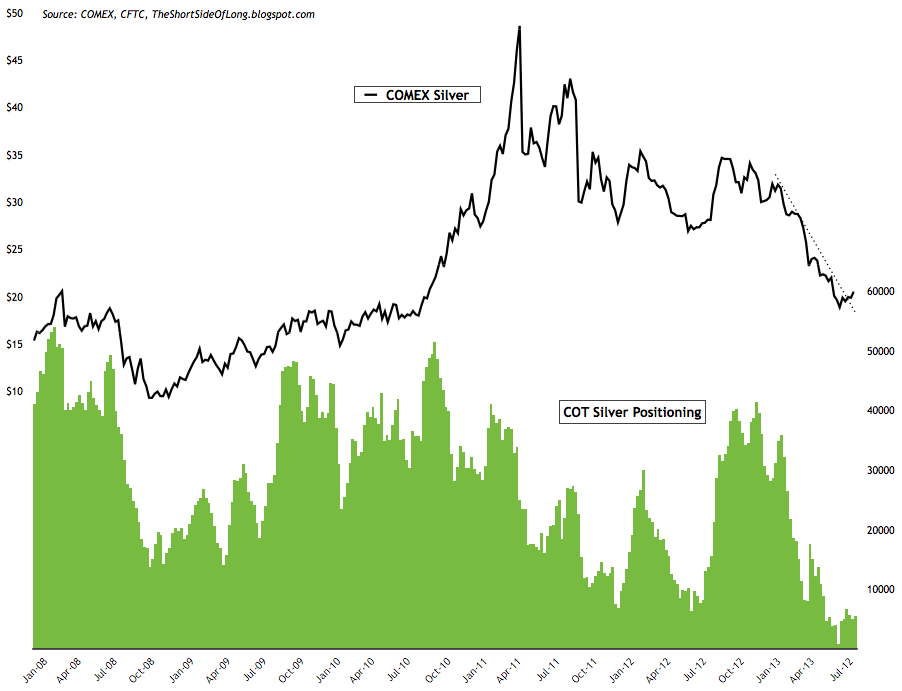
- Last weeks commitment of traders report showed hedge funds and other speculators increased their net long exposure in the precious metals sector. Exposure currently stands at 51,600 net long contracts on Gold and 5,500 net long contracts on Silver. The chart above shows that Silver might have bottomed on the day speculators totally decreased their net long exposure (several weeks ago as readings approached 0). Recent price action seems to be breaking out of its prolonged downtrend.
- Public opinion on alternative currencies like Gold and Silver still continues to remain depressed, which is confirming the ultra bearish COT reports discussed above. Bear market is still in progress but there are signs that we are finally bottoming out. All in all, nothing new to discuss here.
3rd party Ad. Not an offer or recommendation by Investing.com. See disclosure here or
remove ads
.