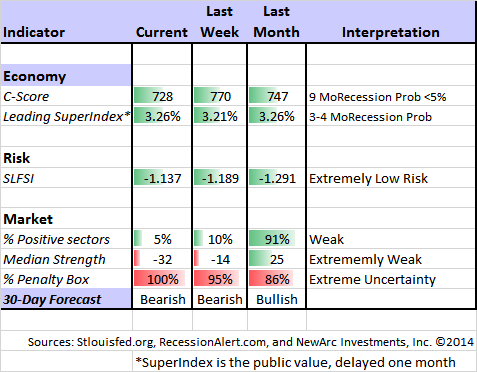
Last week was all about data. This week will be the opposite. The calendar already dished up the big news, and the major earnings reports are still a week away. Meanwhile, we have more conferences and speeches than I can remember seeing for many months. For those of us who think of data as the signal and politicians and pundits as noise, we must get ready for a low ratio!
This week will emphasize commentary rather than data, with world leaders, Fed types, and pundits all joining in.
Prior Theme Recap
In my last WTWA I predicted that the media would focus on how to interpret the deluge of economic reports. That was an accurate guess with plenty of discussion leading up to Friday’s employment report. This week will be tougher.
Feel free to join in my exercise in thinking about the upcoming theme. We would all like to know the direction of the market in advance. Good luck with that! Second best is planning what to look for and how to react. That is the purpose of considering possible themes for the week ahead.
This Week’s Theme
In sharp contrast to last week’s data deluge, we have little important fresh news. Instead there is the biggest speech calendar that I can remember. It includes the following:
World Leaders
- IMF – A big week with multiple appearances
- Briefing on global financial stability – (W)
- IMF and World bank in Washington. (F)
- Director Lagarde debates the global economy (Th)
- G20 Financial ministers – joining the IFM (F)
- Chinese vice minister of finance on the global economy (W)
- US Treasury Sec. Lew on the global economy (Peterson Institute – T)
- European leaders including German Chancellor Merkel and French President Holland join in discussing job creation (W)
- Bank of Japan governor Kuroda at the Economic Club of NY. (W).
Fed Participants
- NY Fed Pres. Dudley: Tuesday
- Ben Bernanke keynote at the World Business Forum (W). I’ll list him as Fed on an “Emeritus” basis. (The Fed Chair can’t get a refi for his mortgage? Inflexible lending standards do not give him credit for those $250K speaking gigs! See the WSJ).
- Vice Chair Fischer joins Lagarde in the job creation debate (Th)
Central Bank Decisions
- Bank of Japan (T)
- Bank of England (Th)
The noise of the speeches will overwhelm the signal of fresh data. We confront a week of interpretation. With the global focus, the question will be:
Will worldwide economic weakness drag down the US economy?
Here are some key takes:
China – Ambrose Evans-Pritchard thinks that the Chinese leadership must get tough in dealing with reformers – an impossible contradiction. Not so, says the new chief economist of the Asian Development Bank.
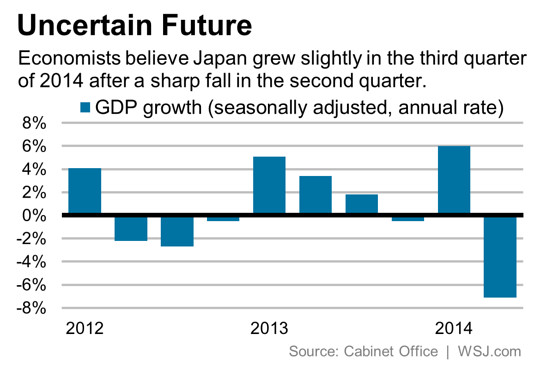
Japan – Economists are lowering growth forecasts despite additional BOJ tweaking of policy.
- Europe – Ukraine’s growth is now on hold until 2016. Russia and Europe are both affected by the reciprocal sanctions. Repeated European economic stories weigh upon US stocks regularly (Bespoke has the chart).
- The IMF warns of a “new mediocre” era.
- On the positive side — Bespoke does note, however, that all but three of the 30 largest country ETFs trading in the US are now oversold.
- The IMF (via Econbrowser) reports dramatic improvement in global trade imbalances.
This is a complex story, with no easy answers. I expect it to be the focus for the week ahead.
As usual, I have a few thoughts about this topic. First, let us do our regular update of the last week’s news and data. Readers, especially those new to this series, will benefit from reading the background information.
Last Week’s Data
Each week I break down events into good and bad. Often there is “ugly” and on rare occasion something really good. My working definition of “good” has two components:
- The news is market-friendly. Our personal policy preferences are not relevant for this test. And especially – no politics.
- It is better than expectations.
The Good
There was a lot of very good news, supporting the general thesis of economic strength.
- Jobless claims near a fourteen year low. James Picerno accurately forecast that this implied an upward revision for the August reports.
- Income was up 0.3% and spending 0.5% — both exceeding expectations.
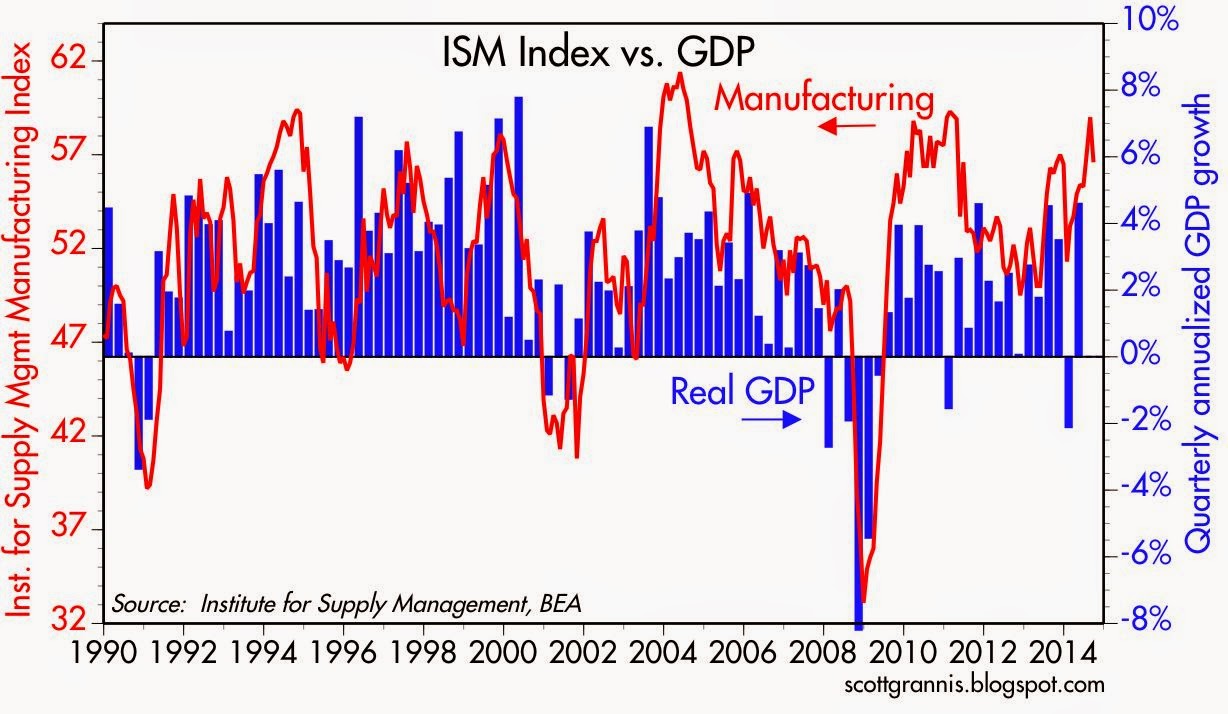
- ISM reports were positive. The services index was 58.6, down very slightly from last month and beating expectations. (Doug Short). The manufacturing report was a slight miss of expectations at 56.6, but continues at a very strong level. ISM says that it is consistent with GDP gains of 4.4%. Scott Grannis notes the strength and provides this chart:
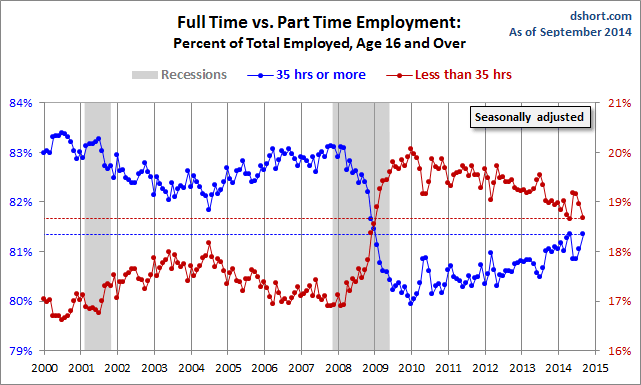
- The employment report was positive. “Party like 1999,” suggested Calculated Risk. The biggest drawback was the lack of wage growth, which has a bright side for investors. The Fed is likely to delay rate increases. Doug Short looks more closely at the improvement in the part-time ratio for the core employment group. Here is the key chart:
Scott Grannis is less impressed, noting that the long-term growth of private employment is about what it has been.
Bob Dieli sees something for everyone:
This report is a spinner’s dream. As we shall see, there is something for those who want to spin “it’s good and getting better” as well as for those “it’s as good as it’s going to get” as well as for those who subscribe to the “it’s another pack of lies” school of thought. I will offer my conclusions as we go through the charts.
Here is a crucial one, where he analyzes labor force participation, the unemployment rate, and the Fed.
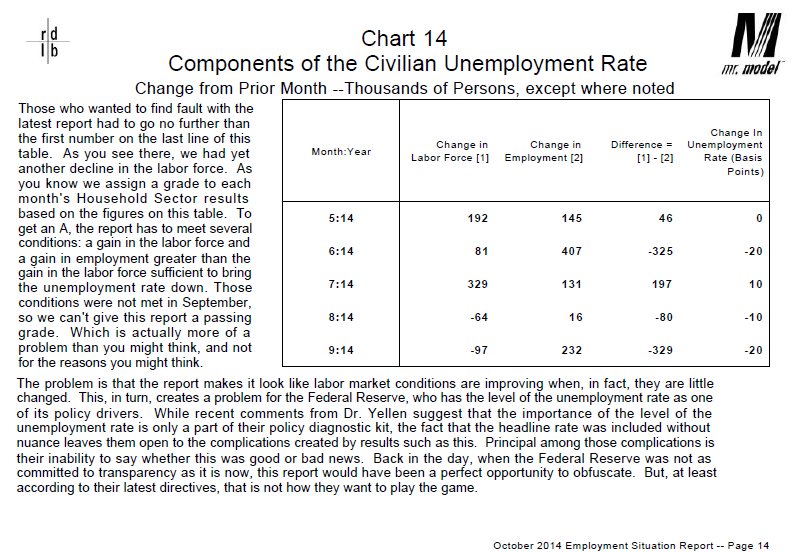
Special thanks to Bob, who has agreed to share his most recent employment update with readers of this site.This report, published monthly, covers every aspect of the employment story. The big themes that you see in other sources – labor force participation, part time employment, household versus establishment surveys – are all treated with Bob’s special insight and wit. There is also a great package of charts. Here is the link for this month.
The Bad
There was also some softer economic news.
Trade data were mixed at best despite beating expectations. Steven Hansen of GEI sees little support for economic expansion.
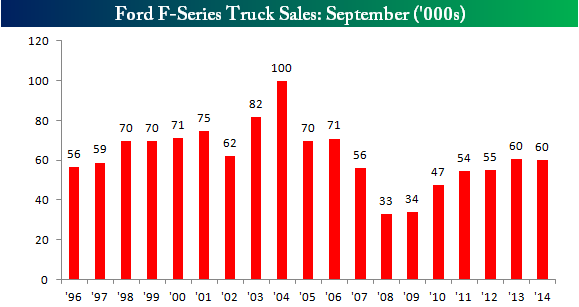
- The auto sales rate beat some expectations but declined from the prior month (Calculated Risk). The F-150 indicator also showed weakness, although Bespoke notes that this is partly due to the model changeover. Where are sales increasing? Sport utility vehicles! (the FT)
- Home prices edged lower according to the Case-Shiller index. As always Calculated Risk has a full discussion and some helpful charts.
- Consumer confidence in the Conference Board measure plunged. Doug Short has an excellent discussion including his famous charts and quotations from the report. The declines included a sharp fall in the short term business and jobs outlook. I see the data as important for consumption and an independent read on job creation.
The Ugly
This week’s “ugly award” goes to the U.S. Secret Service. Protecting the President is a bipartisan issue that united Congressional inquisitors. Congress has an official oversight function (making sure that policies are implemented as intended) and also an investigative function (to help in planning new laws). After one day of testimony before the House Oversight Committee, Director Julia Pierson resigned.
There has been a sad recent shift in performance after a long and storied tradition of heroic efforts by Secret Service agents.
The Silver Bullet
I occasionally give the Silver Bullet award to someone who takes up an unpopular or thankless cause, doing the real work to demonstrate the facts. Think of The Lone Ranger.
This week I was intrigued by the dueling videos of the “bendgate” controversy. Originally I was impressed by the apparent inconsistencies in the original video, exposed here, as well as the conflicting Consumer Reports test. Some even suspected a profit-oriented conspiracy. (Phil’s Stock World)
Now there are more “uncut” videos and stories about bent iPhones in store displays. I cannot decide who wins!
I do know from personal experience that if someone leaves an iPod on a car fender where it can fall if, and then runs over it, you will need a new iPod.
Quant Corner
Whether a trader or an investor, you need to understand risk. I monitor many quantitative reports and highlight the best methods in this weekly update. For more information on each source, check here.
Recent Expert Commentary on Recession Odds and Market Trends
Doug Short: An update of the regular ECRI analysis with a good history, commentary, detailed analysis and charts. If you are still listening to the ECRI (three years after their recession call), you should be reading this carefully. Doug includes the most recent ECRI discussion concerning continuing economic weakness in Japan. Doug covers the possible implications for the US. The ECRI has an update criticizing the Fed analysis of labor markets. This deserves discussion, but is beyond our scope in the weekly article.
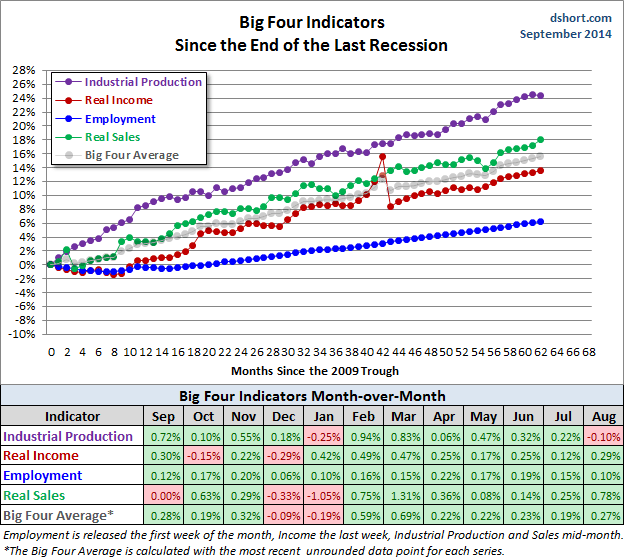
It is time for an update of Doug’s regular analysis of the Big Four economic indicators. If you had to pick one source for a pulse of the economy, this would be it.
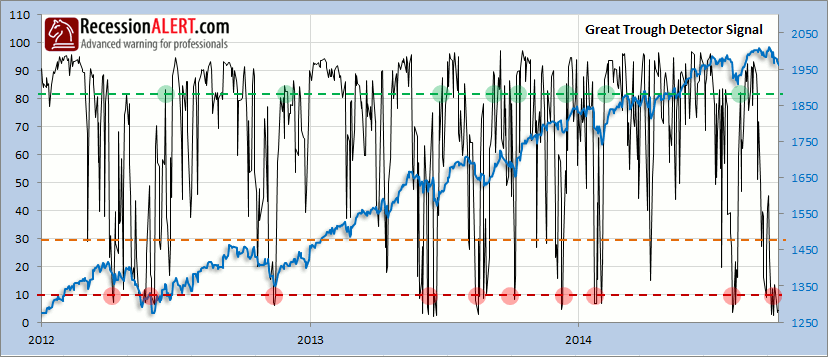
RecessionAlert: A variety of strong quantitative indicators for both economic and market analysis. While we feature the recession analysis, he also has a number of interesting market indicators. His most recent update digs deeper into the breadth deterioration that has been a popular topic over the last few weeks. Dwaine notes the possible actionable events from his most recent Great Trough signal. Read the entire post, but be prepared to add context from your other work.
Georg Vrba: Updates his unemployment rate recession indicator, confirming that there is no recession signal. Georg’s BCI index also shows no recession in sight. Georg continues to develop new tools for market analysis and timing. Some investors will be interested in his recommendations for dynamic asset allocation of Vanguard funds. Georg also is working on methods to improve performance from low-volatility stocks. I am following his results and methods with great interest.
I added to the recession discussion with some comments on the 2011 ECRI forecast and a possible repeat given current commodity prices.
Bob Dieli does a monthly update (subscription required) after the employment report and also a monthly overview analysis. He follows many concurrent indicators to supplement our featured “C Score.”
The Week Ahead
We have an extremely light week for economic data and events.
The “A List” includes the following:
- Initial jobless claims (Th). The best concurrent news on employment trends.
- FOMC minutes (W). Just in case Fed pundits did not fund the statement, the press conference, the forecasts and the dot plots to be enough!
The “B List” includes the following:
- JOLTS Report (T). This is important as an indicator of employment health via the “quit rate” but also for data on whether unemployment is structural. Most people misinterpret and misuse this report.
- Wholesale inventories (Th). August data with implications for Q3 GDP.
There are a few early earnings reports, but the main feature of the calendar will be speeches. As has become customary in recent weeks, news from the world’s hot spots may well have an effect.
How to Use the Weekly Data Updates
In the WTWA series I try to share what I am thinking as I prepare for the coming week. I write each post as if I were speaking directly to one of my clients. Each client is different, so I have five different programs ranging from very conservative bond ladders to very aggressive trading programs. It is not a “one size fits all” approach.
To get the maximum benefit from my updates you need to have a self-assessment of your objectives. Are you most interested in preserving wealth? Or like most of us, do you still need to create wealth? How much risk is right for your temperament and circumstances?
My weekly insights often suggest a different course of action depending upon your objectives and time frames. They also accurately describe what I am doing in the programs I manage.
Insight for Traders
Felix has continued the bearish call initiated last week. Most sectors have a negative rating and the broad market ETFs are also tilting negative. As I predicted last week, our Felix trading accounts are now invested in two inverse ETFs for the first time in more than a year.
You can sign up for Felix’s weekly ratings updates via email to etf at newarc dot com.
Insight for Investors
I review the themes here each week and refresh when needed. For investors, as we would expect, the key ideas may stay on the list longer than the updates for traders. The current “actionable investment advice” is summarized here. In addition, be sure to read this week’s final thought.
We continue to use market volatility to pick up stocks on our shopping list. We do this because we also sell positions when they reach our (constantly updated) price targets. Being a long-term investor does not require you to “buy and hold.” Taking advantage of what the market is giving you is always a good strategy.
Here is our collection of great investor advice for this week:
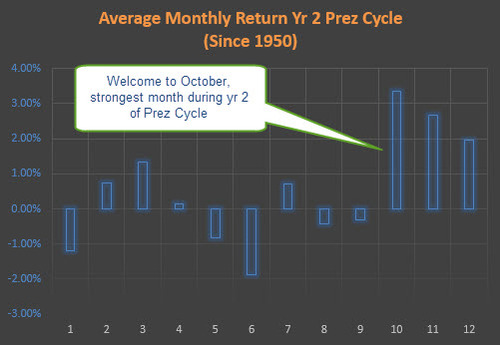
Seasonal Strength. This is the strongest quarter of the Presidential cycle, often the source of major gains. Regular readers know that I am not a big fan of these seasonal analyses, preferring to emphasize the fundamentals and conditions of the moment. Having said this, we mention the negative seasonal factors and they certainly get plenty of media buzz. Just for balance you should read these two excellent posts:
- Ryan Detrick has plenty of data and this chart:
- Dana Lyons identifies it as the best three-quarter stretch of the election cycle:
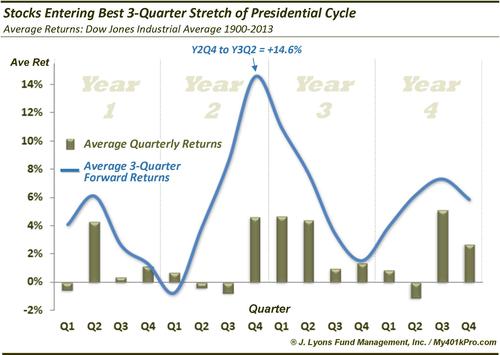
This seems like the right conclusion:
The takeaway? Seasonal patterns and cycles are general tendencies formed over long periods. As such, they should be treated as secondary indicators. That said, the Presidential Cycle has been one of the more consistent seasonal cycles. Therefore, while it is not a lock, the next 3 quarters should provide a slight tailwind for stock investors.
Watch out for bond ETFs with illiquid holdings. David Merkel’s thoughtful analysis describes how these holdings are priced during the time when there is no trading. He also shows what might happen if there was a rush to sell the ETF. His advice? You had better know what you own!
Look more broadly for dividends. Morgan Housel notes the declining dividend rate in the S&P 500 and suggests some alternatives – technology and overseas.
The dollar has made an extended move, but may be nearing resistance according to this post from Josh Brown. This has been a major factor in helping some stocks while hurting others.
If you are stuck in gold or out of the market completely, you might want to reconsider your approach. The current economic cycle is in the fifth inning. This is one of the problems where we can help. It is possible to get reasonable returns while controlling risk. Check out our recent recommendations in our new investor resource page — a starting point for the long-term investor. (Comments and suggestions welcome. I am trying to be helpful and I love and use feedback).
Final Thought
The picture among the major economies remains mixed. I like this summary chart from the helpful Schwab Market Perspective article:
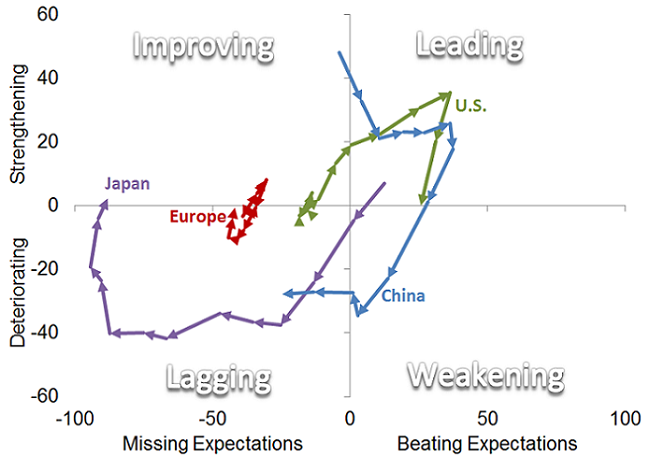
The Schwab team summarizes the other major economies as follows:
Outside the United States, Europe is flirting with another recession and deflation, Japan is trying to pull itself out if its long-standing malaise, and Chinese growth is slowing. Emerging markets look attractive.
They also note that despite the international risks, a US recession does not seem to be imminent.
This is completely consistent with the excellent indicators that I update each week, so my answer to the headline question is “No.”
In looking at the expected speeches, the negative stories were prominent. Whenever there is a long list of widely-known negatives, investors should also ask whether something might go right!

