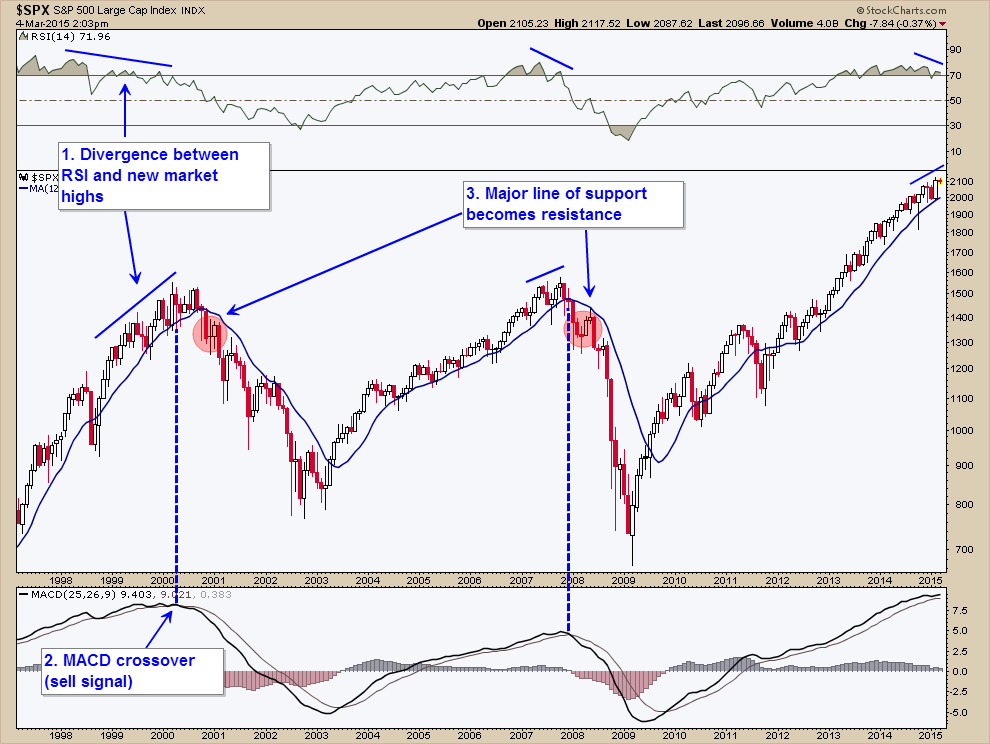
Update: The market's push to record new highs last month failed to prevent a significant divergence from forming with the relative strength index. This is one of the three signs I highlighted for a possible peak in stocks. See updated chart and commentary below...
It is said that an image is worth a thousand words. This chart conveys a very important message when it comes to the future direction of the stock market and whether investors should be concerned about a coming bear market. We explain the chart in more detail below.
In the very top panel of the chart you’ll notice that the stock market as measured by the S&P 500 is overbought on a long-term basis. This is no surprise and shows that we are now trading at levels seen during the two prior market tops. That said, the stock market can remain in overbought territory for an extended period of time, which is why we need to focus on more timely signals (red flags) for when this condition may reverse. Of the three I present, one has now been raised.
Red Flag Number One (√)
The first technical warning sign that we should heed is marked by a significant divergence between the relative strength index (RSI) and the market itself. This is noted by a declining pattern of lower highs in the RSI as stocks continue to make higher highs, a sign that the market is “topping out”. In the late ‘90s this divergence persisted for many years as stocks made increasing higher highs. In 2007 this divergence lasted over a much shorter period (6 months) before the market finally peaked and succumbed to massive selling. With last month's strong rally to new record highs, we now have a confirmed divergence between the long-term relative strength index and the market’s price action (as shown in the chart above).
Since this divergence can persist for months or years, we also look to two other technical red flags for possible signs of a market peak and impending bear market.
Red Flag Number Two
The second technical sign to look for is a major crossover in the MACD (moving average convergence-divergence) indicator shown in the bottom panel. This is often used by technical analysts as a buy and sell signal. As Investopedia explains, “when the MACD falls below the signal line, it is a bearish signal, which indicates that it may be time to sell.” As shown by the dotted lines, a MACD crossover occurred in May of 2000 and December of 2007. Currently, we see the market has steadily lost momentum since the beginning of 2014 but has yet to issue a sell signal. A sustained break below the 12-month moving average may trigger such an event. That brings us to the third technical signal we need to watch.
Red Flag Number Three
When a major line of support becomes resistance, you now have confirmation of a trend change in the market. This occurred around January-February of 2001 and May-June of 2008 (see red circled regions on the chart) when the S&P 500 failed to break back above its 12-month moving average. After that point in time, the market persisted in a bearish downtrend until a confirmed change of direction with a new bull market. Currently, the market is trading above this major line of support and only briefly broke below in October of last year.
Summary
One of the three red flags we should watch for gauging a possible market peak has been raised. Since this first technical warning sign can persist for a period of months to years (remember, market tops are a process and not an event), we will now want to see if a major sell signal is triggered by a crossover in the MACD, as occurred at both prior tops in 2000 and 2007, and then lastly with a major trend change when the 12-month moving average no longer acts as support, but now becomes a line of major resistance.
Again, we should not presuppose this pattern will play out on an immediate timeframe. The market may make new highs in overbought territory with a continuous divergence on the RSI. As always, opinions are quite divided on whether stocks are already in a bubble or, conversely, in the beginning stages of a much larger advance (see Martin Armstrong's interview below). There are too many moving parts to predict such outcomes with any certainty. Instead, we must monitor market action, incoming data, and make adjustments as the situation requires. The chart presented is one of many tools for doing just that.

