Analyzing the Forecasters
How overoptimistic are Wall Street forecasts year in and year out?
Salil Mehta, business statistics professor at Georgetown University addresses that question on his "Statistical Ideas" blog: Strategists Full of Bull.
Mehta collected 186 public forecasts from 1998-2015 of the annual ritual of making market projections for the year ahead.
Firms included JPMorgan (N:JPM), Citigroup (N:C), Goldman Sachs (N:GS), Merrill Lynch, Bear Stearns, Lehman, Morgan Stanley (N:MS), Prudential (L:PRU), UBS, AG Edwards, Bank of America (N:BAC), etc. Not every company made a forecast every year. Some of the firms are now extinct.
Data primarily comes from Barron’s as far back in time as continuously available. For a couple years, when Barron’s data wasn’t easily available, Mehta used market prediction made in USA Today’s or similar surveys.
Forecasters Full of Bull
Results were no better than a coin toss as to whether the S&P 500 came in above or below the average forecast.
Nonetheless, every year had one thing in common: Not once did a consensus predict a down year.
On average, forecasts were wildly bullish, even with the gains in recent years.
In his analysis, Mehta focused primarily on distribution and standard deviations. Some may find his dispersion charts confusing. To his credit, Mehta made his Analyst Forecast Data available for others to analyze and I took him up on it.
Data prior to 2001 was for the Dow Jones 30. I used years 2001-2015 in my analysis so the numbers are consistent line to line.
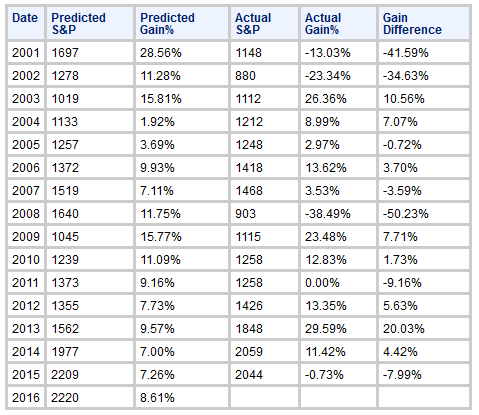
In the table below, S&P 500 projections are the average of all the analysts making calls for that year.
S&P 500 Predicted Gains vs. Actual Gains 
15-Year Results
- Actual gains were negative 4 times, zero 1 time, positive 10 times.
- Analysts overestimated the actual result 7 times and underestimated results 8 times. That's a coin toss. What follows shows distinct bullish bias.
- Analysts projected gains 100% of the time.
- Spectacular misses (30% or more) were all in down years.
- The average year-to-year projected gain over 15 years was 9.85%.
- The average actual gain over 15 years was 4.75% (slightly less than half projection).

2016 Analysis
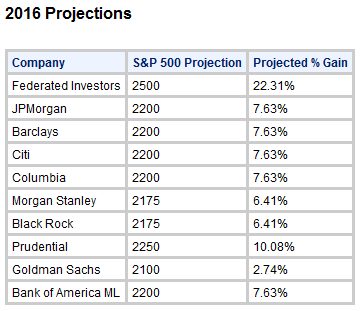
For 2016, five out of ten companies predicted the S&P would end the year at 2200. Is that the magic number?
Goldman Sachs dared to be significantly different on the low side with a +2.74% forecast. Federated Investors projects a whopping +22.31% gain.
As typical, no company forecasts a decline.
Results year-to-date through January 17: -8.02%.
Don't worry, it's early.
