I certainly didn’t invent the term bear market math, yet it tends to be a phrase that causes everyone to sit up straight and listen. The easiest way to define this arithmetic is to show you some quick illustrations of how big of a gain is needed to recover from a devastating loss in your investment portfolio.
- A 20% decline requires a 25% gain to get back to break even.
- A 30% decline requires a 43% gain to get back to break even.
- A 40% decline requires a 67% gain to get back to break even.
- A 50% decline requires a 100% gain to get back to break even.
The most appropriate application of this math is the avoidance of undue risk in your investment portfolio. For the majority of investors, that means having a properly diversified account structure that is spread amongst multiple non-correlated asset classes to avoid overdependence on a specific outcome. Stocks, bonds, real estate, commodities, and cash are just some of the most commonly used tools for this task.
In addition, more proactive investors may opt for risk management tools such as stop losses or defined exit points to mitigate the risk of individual positions. Exiting an investment at a small loss is always easier to swallow than trying to hold on to hope that it will recover from a big drawdown that weighs like an anchor on your returns.
After hearing so much this week about the spike in the CBOE Vix Volatility Index (VIX), I wanted to apply this logic to exchange-traded products that track this index. The most widely held and heavily traded vehicle in this space is the iPath S&P 500 VIX Short Term Futures ETN (NYSE:VXX).
In simple terms, VXX is designed to spike during periods of fear as gauged by the options activity in the S&P 500 Index. Conversely, this fund tends to drift lower as the gauge swings back to risk taking (greed) in stocks.
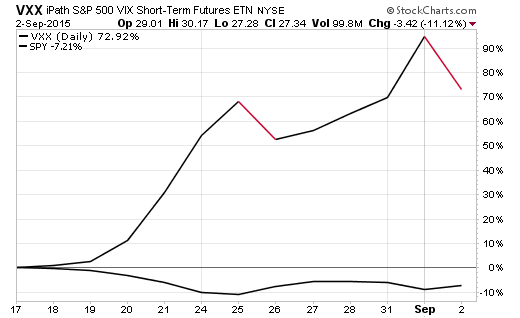
Since August 18, VXX has surged 73%, while the SPDR S&P 500 ETF (NYSE:SPY) has fallen 7%. That tremendous push higher enabled volatility-linked products to claim the top spot in performance rankings for August.

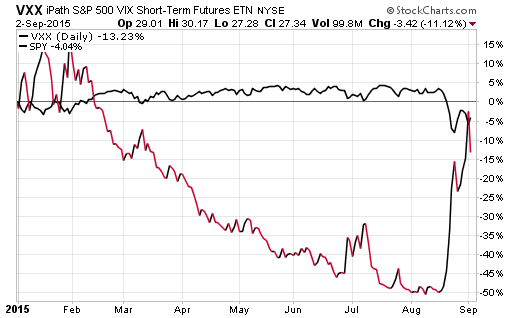
Yet interestingly enough, VXX is still down more than 13% on a year-to-date basis versus a decline of 4% in SPY. While the short-term move is impressive, the real story is how much damage these funds can cause over longer periods of time.

The Bottom Line
As I’ve said before, volatility ETFs should be avoided by all but the most experienced traders with short-term time horizons and defined risk parameters. The more important lesson in this example is how difficult it is to recover from big losses. Even a 70%+ gain wasn’t enough to put VXX back in the black for the year.
My recommendation is to take a hard look at how your portfolio has performed during the recent drawdown. I find it useful to evaluate individual positions as well as the total return of the portfolio versus an established benchmark. That way you can objectively identify both strengths and weaknesses in order to properly align your investment structure with your overall risk tolerance.
If you do recognize changes that need to be made, make sure that you do so in a methodical manner at opportunistic entry or exit points. This will provide a solid foundation for new positions and possibly alleviate some anxiety caused by underperforming investments.
Disclosure: FMD Capital Management, its executives, and/or its clients may hold positions in the ETFs, mutual funds or any investment asset mentioned in this article. The commentary does not constitute individualized investment advice. The opinions offered herein are not personalized recommendations to buy, sell or hold securities.
