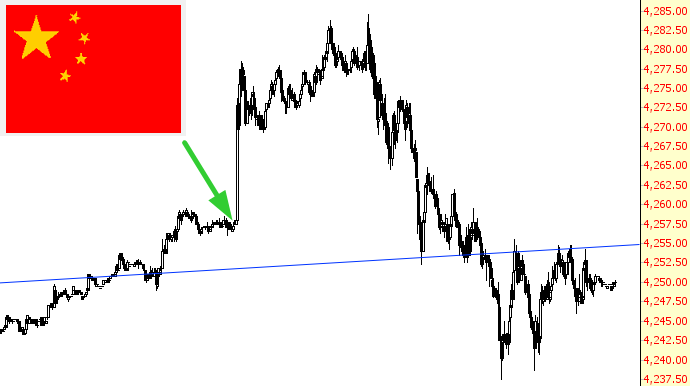
As the entire world knows by now, China joined the rest of the world’s central banks in more “easing”, which sent markets into a spastic move higher. As you can see by this view of the NQ, this massively bullish news has not, as of yet, represented any kind of sea-change in the markets. Before the day was even out (again, in some, not all markets), the entire move up was reversed.
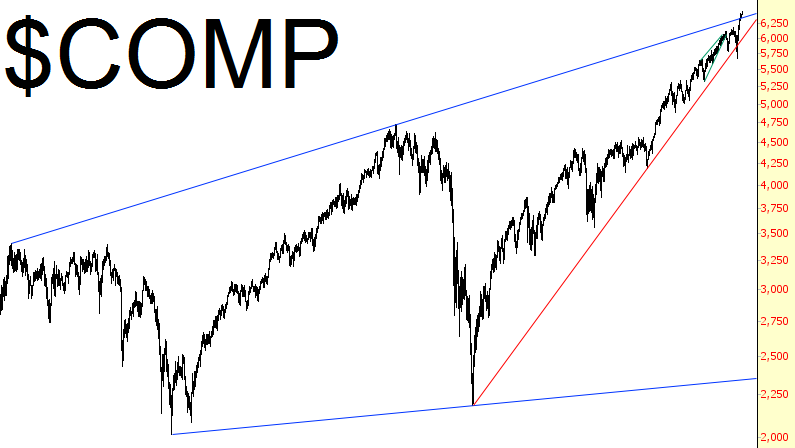
As noted in my Bear Despair post earlier this week, however, the bulls are still firmly in control, with all the central banks as their allies. The Dow Jones Composite hit yet another lifetime high, and it has exceeded even its long-term resistance line (in blue):
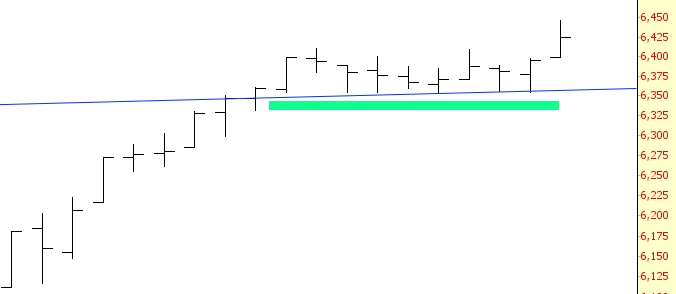
A much closer look at this line shows how, once the price has pushed above it, the line changed from resistance to support. For ten days, the price valiantly obeyed support and then finally leaped above it. Until the price breaks that trendline again, the bulls have the bears by the short hairs.
On a very long-term perspective, the NASDAQ Composite blew past the point that it “should” have stopped many months ago, marked by the arrow. Incredibly, the NASDAQ is approaching the levels it saw during the insaner-than-insane 2000 Internet peak.
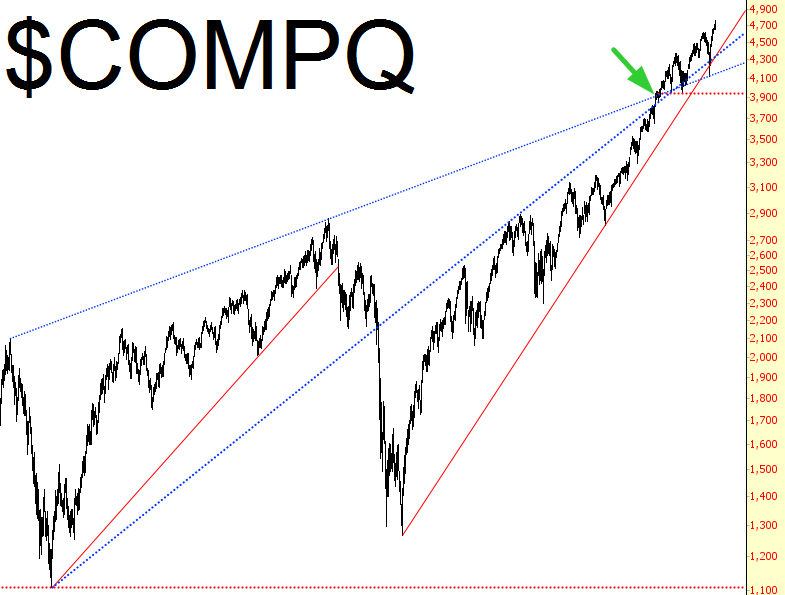
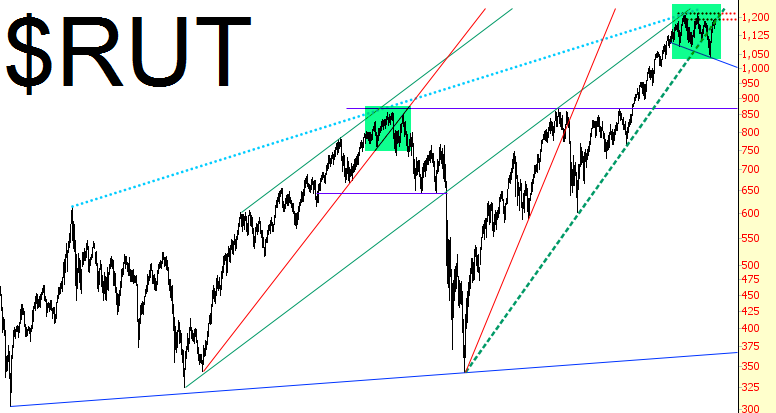
As fantastic as the S&P 500 and the Dow 30 have been for the bulls, the much broader small cap index continues to show middling performance. My view continues to be that we are simply grinding out a top; I’ve tinted the analogous regions in green below.
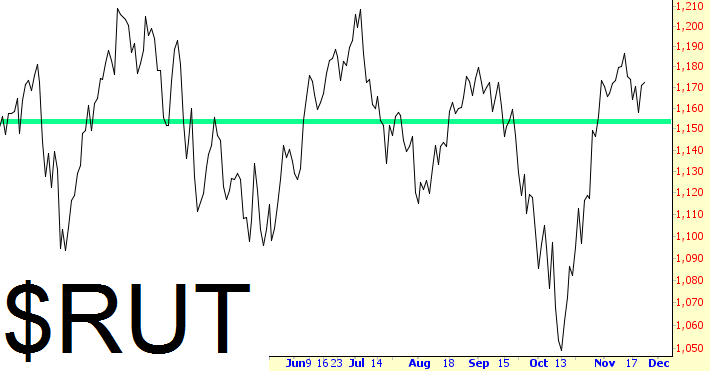
This year alone, for example, the Russell 2000 is close to unchanged. With all the massive QE going on from Japan, China, Europe, and the U.S., a gain of 1% is really nothing to write home about. One can only imagine what the markets would be doing in natural circumstances, with no intervention (hint: much, much lower).
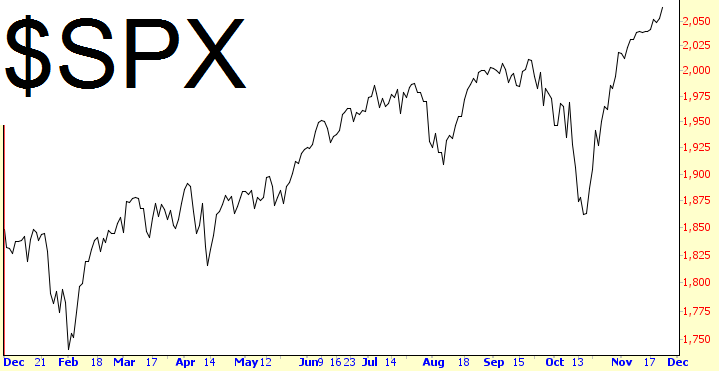
In sharp contrast, 2014 has been kind to the S&P 500 The past five weeks have yielded over 200 points on the S&P.
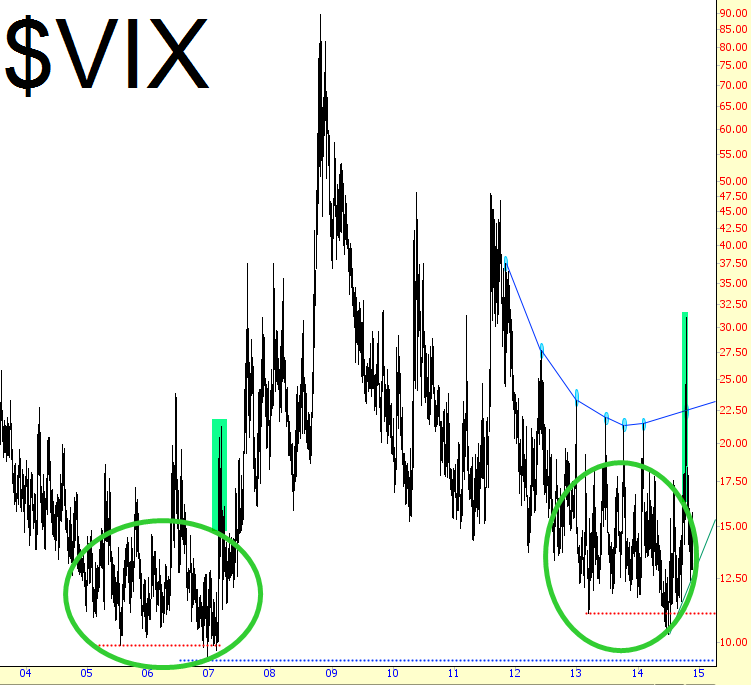
Just as I think the small caps are grinding out a top, I likewise believe the VIX is performing the same action. We got our first taste of VIX potential in late July/early August, and then we got a much better taste during the first couple of weeks of October. Who knows where the next surge will come from (did anyone really expect Ebola to be the cause last time?), but as long as we keep painting out a series of higher lows, the potential is still there.
