Get 40% Off
⚠ Earnings Alert! Which stocks are poised to surge?
See the stocks on our ProPicks radar. These strategies gained 19.7% year-to-date.
Unlock full list

S&P 500: Valuations Not At Nose-Bleed Levels, Yet

Published 11/25/2014, 07:18 AM
Updated 07/09/2023, 06:31 AM

The recent run in the major U.S stock indices has resulted in Schiller-PE charts being trotted out showing how far we are off the historical mean, implying a nasty pullback is in the works. The problem with a historical mean is that it is a single horizontal value on a chart that fails to take cognisance of any long-term trending the underlying valuation series may be experiencing.

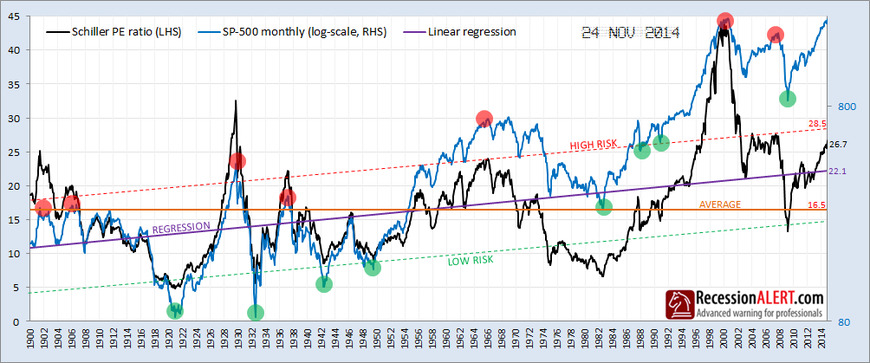
Thus we prefer to use the linear regression mean as opposed to the simple average mean when it comes to looking at these kinds of charts. The simple average of the Schiller P/E is now 16.5, implying the current reading of 26.7 is alarmingly off-base. However the regression mean is 22.1 which paints a far less alarming picture:

Shiller P/E Ratio vs SP Monthly vs Linear Regression

If we draw parallel lines one standard-deviation either side of  the regression mean, we get a better indication of what constitutes “nose-bleed” levels, represented by the red and green shaded circles. These represent once-in-a-decade extremes of over-valuation (red circle) or under-valuation (green circle).

Whilst there is no denying that the Schiller PE is showing we are currently in “historically expensive territory”, the regression lines show we are not yet in nose-bleed territory and there is easily more upside available in the stock market, at least according to this model everyone is trotting out.

Latest comments

Thanks for nothing.
Why use linear regression? Looks to me like anytime its near or above 25 is more accurate than the LR line. LR line also just uses a hindsight look, ie that line wouldve been different if you viewed it in 1950
Risk Disclosure: Trading in financial instruments and/or cryptocurrencies involves high risks including the risk of losing some, or all, of your investment amount, and may not be suitable for all investors. Prices of cryptocurrencies are extremely volatile and may be affected by external factors such as financial, regulatory or political events. Trading on margin increases the financial risks.
Before deciding to trade in financial instrument or cryptocurrencies you should be fully informed of the risks and costs associated with trading the financial markets, carefully consider your investment objectives, level of experience, and risk appetite, and seek professional advice where needed.
Fusion Media would like to remind you that the data contained in this website is not necessarily real-time nor accurate. The data and prices on the website are not necessarily provided by any market or exchange, but may be provided by market makers, and so prices may not be accurate and may differ from the actual price at any given market, meaning prices are indicative and not appropriate for trading purposes. Fusion Media and any provider of the data contained in this website will not accept liability for any loss or damage as a result of your trading, or your reliance on the information contained within this website.
It is prohibited to use, store, reproduce, display, modify, transmit or distribute the data contained in this website without the explicit prior written permission of Fusion Media and/or the data provider. All intellectual property rights are reserved by the providers and/or the exchange providing the data contained in this website.
Fusion Media may be compensated by the advertisers that appear on the website, based on your interaction with the advertisements or advertisers.
© 2007-2024 - Fusion Media Limited. All Rights Reserved.