Volatility is a key consideration for both stock selection and option-selling decisions. Despite its relevance to our covered call writing and put-selling selections, volatility does have its limitations and we must fully understand how we can best take advantage of the information gleaned from volatility statistics.
Types of volatility
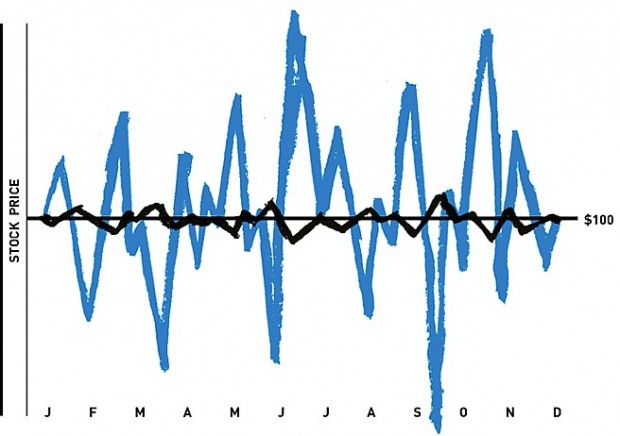
Historical volatility: The annualized standard deviation of actual past stock prices. Even if two stocks start and end at the same price over a period of one year, they can have very different historical volatilities as reflected in the chart below:

Historical Volatility of Two Stocks
Note that both stocks begin and end the year priced at $100.00 per share, but the “blue” stock was much more volatile over that time frame. This demonstrates that historical volatility is not based on a directional trend but rather on the amount that the price oscillates.
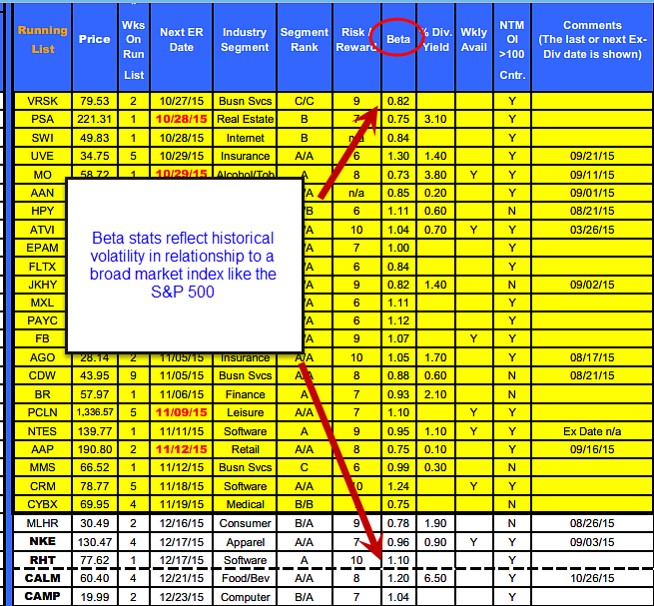
Our Premium Member Stock Reports give historical volatility information as it relates to the S&P 500 in our “running list” as shown in the screenshot below:

Beta stats from our Premium Stock Reports
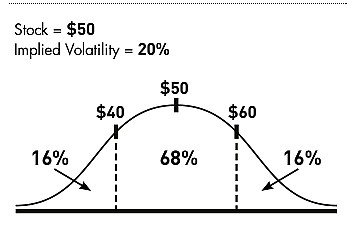
Implied volatility: This is the market’s forecast of the stock’s annualized standard deviation volatility based on price changes in the option. This is more important to short-term option-sellers than is historical volatility because it is forward-looking. Implied volatility will impact the time value component of an option premium only and has no effect on intrinsic value. Implied volatility is expressed as a percentage of the share price, indicating a one standard deviation move over a twelve-month time frame. Let me explain. Let’s say a stock is trading at $50.00 and has an implied volatility (again based on option pricing) of 20%. This means we can anticipate a price fluctuation 0f $10.00 (20% of $50.00) in either direction or a price range from $40.00 to $60.00. The fact that this is an annualized statistic based on one standard deviation means that the range is anticipated over a twelve month time frame and is accurate 68% of the time. This can be better visualized using a normal distribution curve:

Normal Distribution Curve for One Standard Deviation
Note the following:
- Share price is expected to fall between $40.00 and $60.00 68% of the time over a one year time frame
- 16% of the time, share price will be lower than $40.00
- 16% of the time, share price will be greater than $60.00
How is implied volatility calculated?
An option pricing model like Black Scholes is used and the following information is required:
- Stock price
- Strike price
- Expiration date
- Risk-free interest rate
- Dividends (if applicable)
- Option price
Converting implied volatility stats to shorter term options
Since we rarely sell one-year expiration options, we must add one more component to our equation in predicting future price movement based on implied volatility and that is to multiply by the square root of the number of days to expiration divided by 365:
[$50.00 x 20% x SR (Days to Expiration/365)]
Limitations of implied volatility when determining future stock prices
- Does not predict direction
- Depends on market assessment (option prices) which may or may not be accurate
- Based on theoretical calculations from an option-pricing model
- Annualized stats must be converted to the time frame of the option contract
Implied volatility stats are listed on pages 7 and 8 of our Premium Member ETF Reports.
Discussion
Understanding and utilizing volatility statistics are absolutely critical when trading stocks and stock options (exchange-traded funds as well). For short-term option-selling, implied volatility is more relevant than historical volatility. As helpful and useful as these data stats are, we must understand and factor in the limitations they possess so we can best utilize them in our day-to-day investment decisions.
Market tone
Global stocks moved higher due to strong US economic data, strong corporate earnings, China’s rate cut and the expectation of further stimulus from the European Central Bank. Alphabet (Google (O:GOOGL)), Microsoft (O:MSFT), Amazon (O:AMZN), McDonald’s (N:MCD) and General Motors (N:GM) beat earnings estimates, although IBM (N:IBM), Morgan Stanley (N:MS) disappointed. This week’s reports:
- US home resales increased 4.7% in September to an annual rate of 5.5 million units, the second-highest monthly sales pace since February 2007
- The Federal Housing Finance Agency House Price Index (FHFA HPI) rose a seasonally adjusted 0.3% in August, up 5.5% from a year earlier on the strengthening job market and shrinking inventories
- The National Association of Home Builders housing market index rose to a 10-year high of 64 in October
- New home construction starts rose 6.5% in September to an annualized rate of 1.21 million, above consensus and the second-highest level in eight years
- The Bloomberg Consumer Comfort Index fell from 44.5 in September to 42 in October
- Initial jobless claims increased 3,000 to 259,000 for the week ending October 17th, remaining near a 42-year low
- Continuing claims rose 6,000 to 2.17 million for the week ending October 10th
For the week, the S&P 500 rose by 2.07% for a year to date return of 0.79%.
Summary
IBD: Confirmed uptrend
GMI: 6/6- Buy signal since market close of October 19, 2015
BCI: Cautiously bullish using an equal number of in-the-money and out-of-the-money strikes. There are many encouraging signals including the S&P 500 moving above its 50-d and 200-d moving averages and moving into positive territory year-to-date. However, recent volatility and weakness with retail and energy stocks are keeping me fro0m taking more aggressive positions. I remain fully invested.
