A quiet end of the week in Asia but storm clouds appear to be gathering from a technical perspective on JPY Crosses.
Asia definitely has a “Friday” feeling about it today. G-20’s this weekend, BOJ and FOMC next week. Plus, most importantly for this Kiwi, the start of the Super 18 Rugby play-offs tonight, have combined to leave Asia in a wait and see mode across the markets as the week draws to an end.
Most interestingly next week is clearly the Bank of Japan with the street pumped up for announcements of extra large stimulus packages and further QE. The street has been awash with the chatter of 20 Trillion Yen packages and helicopter money.
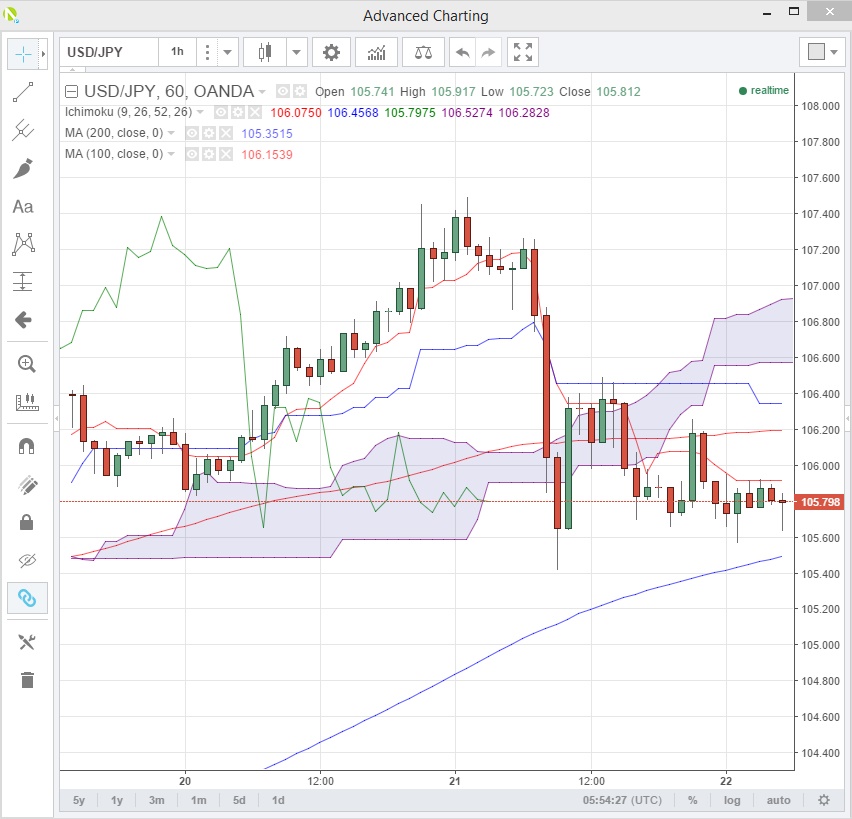
USD/JPY Hourly
It is perhaps indicative of USD/JPY positioning that when the “no helicopter money” headline came out yesterday from BOJ Kuroda that USD/JPY promptly fell 180 points in 30 minutes. When the Nikkei newspaper suggested this morning that the package could be as high as 30 Trillion JPY, USD/JPY popped up to 106.20 before drifting back to its lows around 105.80.
Looking at the hourly chart the recent highs at 106.20 coincide with the 100-hour moving average. Multiple lows around 105.60/65 and the 200 hours moving average at 105.45 form initial support with a break opening a deeper correction.
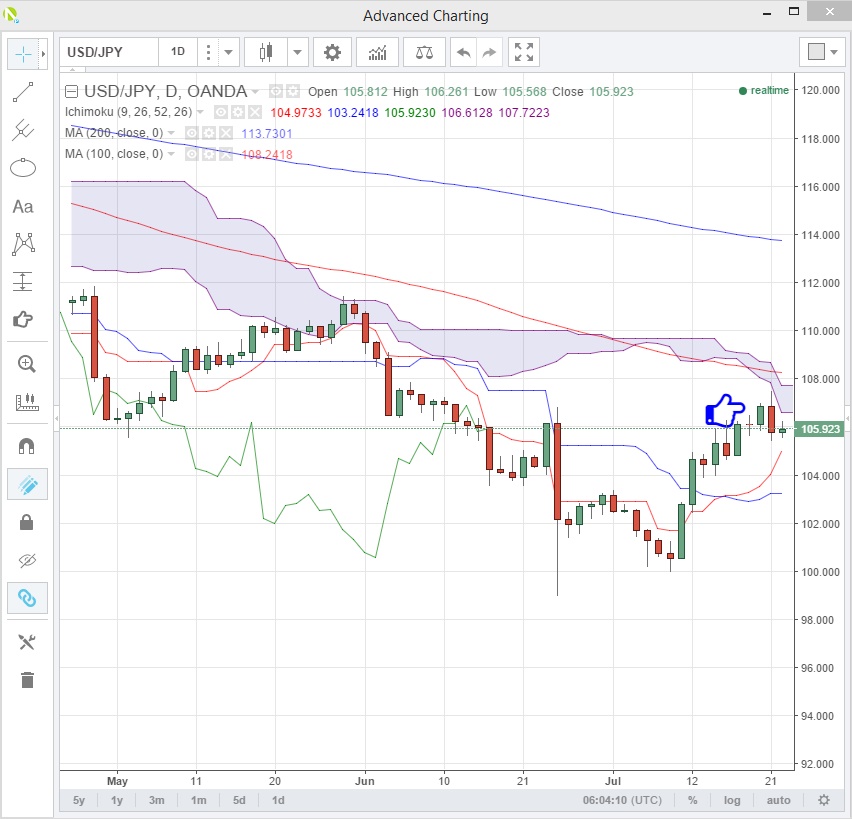
USD/JPY Daily
The daily chart is even more interesting with USD/JPY tracing an outside reversal day yesterday. IE making a new high and then closing at a lower low then the previous day.
Base of the daily ichimoko cloud for at 106.55 first resistance with 104.80 double bottom support.
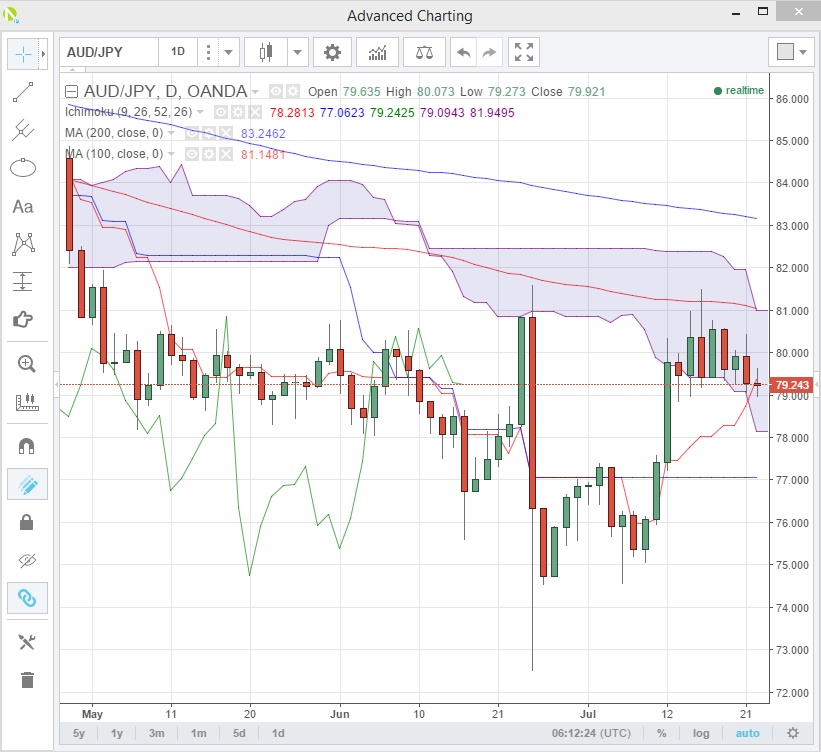
AUD/JPY Daily.
Looking equally unspectacular to finish the week. Another outside reversal day yesterday (bearish engulfing for the purists). The cross has been unable to maintain even yesterdays low. With first meaningful support the cloud base at 78.15. The RBA is widely expected to cut next week. With the potential for further lightening of long XXX/JPY positions and /or BOJ disappointment, there is a meaningful potential for a decent technical move downside. A break of 81.00, the top of the cloud and 100 day moving average negates.
Interestingly in OANDA Labs AUD/JPY long positioning continues to be elevated at 63.45% behind GBP/CHF and XAG/USD.

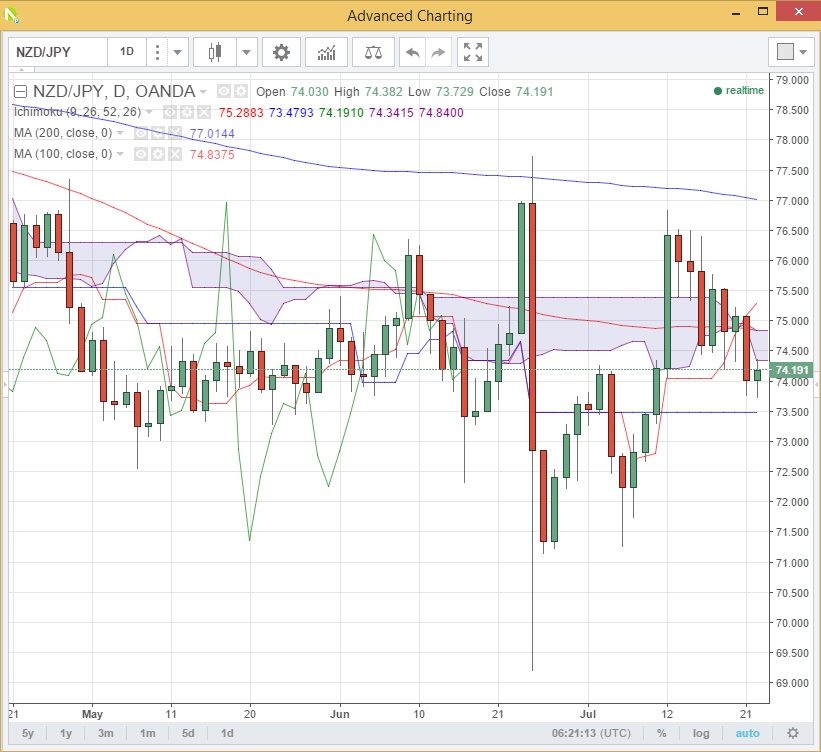
NZD/JPY Daily
A similar picture to the above falling out of the cloud and testing recent lows. Resistance at 74.35 cloud base and then 74.85 cloud top and the 100 day moving average. Again it is all about the BOJ next week but if the RBA were to cut, then the RBNZ is a done deal to cut the week after.
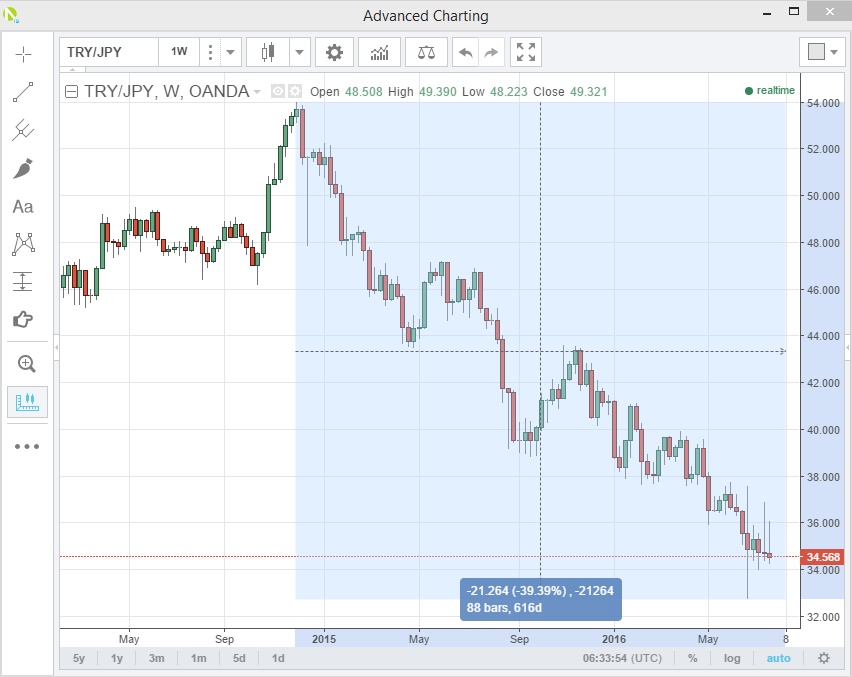
TRY/JPY Weekly
Is this the worst carry trade in the world? For most of the last 18 months, the currency pair with notionally one of the best carry differentials on the planet has lost a whopping 39.39%. (see blue box on chart) With political uncertainty in Turkey set to continue, this one is for the very tactical, or the very brave!
by Jeffrey Halley
