
SGD received a slight boost during early Asian trade on stronger than expected non-oil domestic exports (NODX) in the month of December. NODX was up 6% Y/Y for the month of December, a welcomed reversal from the 8.9% decline in November. This increase in domestic exports suggest that Singapore's economy remain strong, which will help SGD fight against the depreciative wave brought by outflow of foreign investments.
Hourly Chart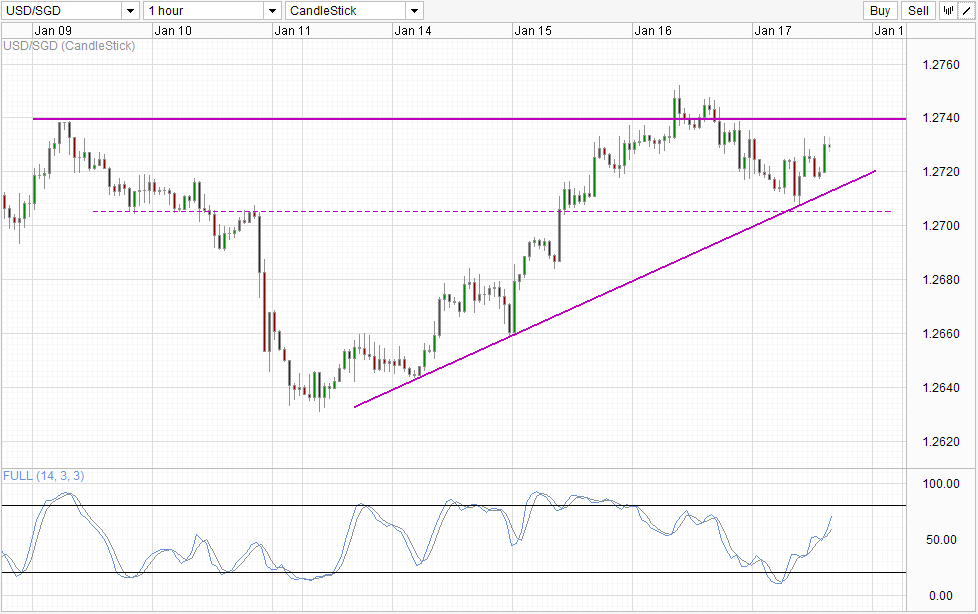 USD/SGD: Hourly" title="USD/SGD: Hourly" height="614" width="978">
However, the gains in SGD was short-lived. USD/SGD quickly recovered, rebounding from the rising trendline and coinciding with a bullish Stoch cycle. This is not really surprising considering that SGD weakness is already established in our analysis yesterday. Furthermore, risk sentiment was bearish during early Asian trade, and that drove safe haven currency USD stronger, allowing USD/SGD to recover quickly after the shallow dip.
Moving forward, a test of 1.274 is possible, but a break of the resistance level is difficult to imagine as Stochastic readings are close to the Overbought region and will be Overbought when prices tag 1.274. Also, even if prices manage to breach 1.274, prices will face further resistance in the form of the swing high yesterday. Given that today is the final trading day of the week, where directional play is difficult to find good follow-through, the likelihood of a outright bullish breakout is unlikely.
Weekly Chart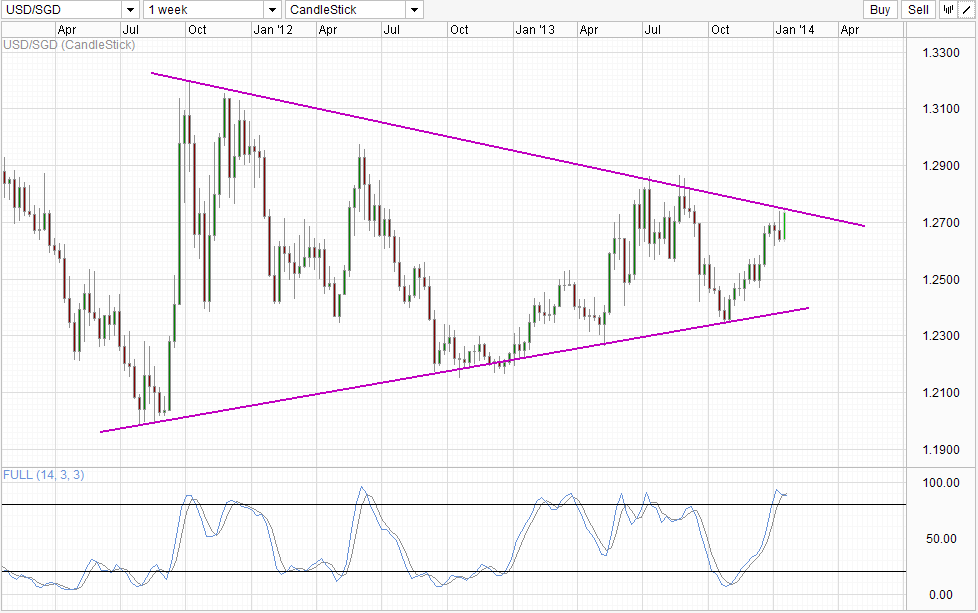 USD/SGD: Weekly" title="USD/SGD: Weekly" height="613" width="978">
Weekly Chart adds more reason why moving higher may be difficult. Prices is currently under bearish pressure from the top of the wedge, with Stochastic readings pointing lower after being in the Overbought region. However, bulls will be glad to know that Stoch curve is not exactly pointing lower right now, and that implies that prices may stay afloat for a while before the next bearish cycle take place. Price action concurs, and we should ideally see a break of 1.27 before the case of a bearish reversal should be contemplated - a move that is likely to coincide with Stochastic readings pushing below 80.0.
As a side note, Singapore non-oil re-exports (NORX) has risen by 14.2%. Exports to both China and US have increased Y/Y, while exports to emerging markets have increased by 15.5%, reversing the 17.8% shrinkage in November. This is a good sign that global trade is recovering, and may be strong evidence that concerns over Chinese slowdown may be overplayed. Similarly, traders thinking that US stocks may pullback in 2014 may need to wait a while more. This is not saying that prices of US stocks aren't expensive, but rather there is no catalysts/evidence that global economy bubble (if any) will suddenly burst anytime soon.
Original Post
- English (UK)
- English (India)
- English (Canada)
- English (Australia)
- English (South Africa)
- English (Philippines)
- English (Nigeria)
- Deutsch
- Español (España)
- Español (México)
- Français
- Italiano
- Nederlands
- Português (Portugal)
- Polski
- Português (Brasil)
- Русский
- Türkçe
- العربية
- Ελληνικά
- Svenska
- Suomi
- עברית
- 日本語
- 한국어
- 简体中文
- 繁體中文
- Bahasa Indonesia
- Bahasa Melayu
- ไทย
- Tiếng Việt
- हिंदी
USD/SGD Technicals: Stronger NODX But S/T Up Trend Remains
ByMarketPulse
AuthorMingze Wu
Published 01/17/2014, 06:36 AM
Updated 03/05/2019, 07:15 AM
USD/SGD Technicals: Stronger NODX But S/T Up Trend Remains
3rd party Ad. Not an offer or recommendation by Investing.com. See disclosure here or
remove ads
.
Latest comments
please uptade dates
Install Our App
Risk Disclosure: Trading in financial instruments and/or cryptocurrencies involves high risks including the risk of losing some, or all, of your investment amount, and may not be suitable for all investors. Prices of cryptocurrencies are extremely volatile and may be affected by external factors such as financial, regulatory or political events. Trading on margin increases the financial risks.
Before deciding to trade in financial instrument or cryptocurrencies you should be fully informed of the risks and costs associated with trading the financial markets, carefully consider your investment objectives, level of experience, and risk appetite, and seek professional advice where needed.
Fusion Media would like to remind you that the data contained in this website is not necessarily real-time nor accurate. The data and prices on the website are not necessarily provided by any market or exchange, but may be provided by market makers, and so prices may not be accurate and may differ from the actual price at any given market, meaning prices are indicative and not appropriate for trading purposes. Fusion Media and any provider of the data contained in this website will not accept liability for any loss or damage as a result of your trading, or your reliance on the information contained within this website.
It is prohibited to use, store, reproduce, display, modify, transmit or distribute the data contained in this website without the explicit prior written permission of Fusion Media and/or the data provider. All intellectual property rights are reserved by the providers and/or the exchange providing the data contained in this website.
Fusion Media may be compensated by the advertisers that appear on the website, based on your interaction with the advertisements or advertisers.
© 2007-2024 - Fusion Media Limited. All Rights Reserved.