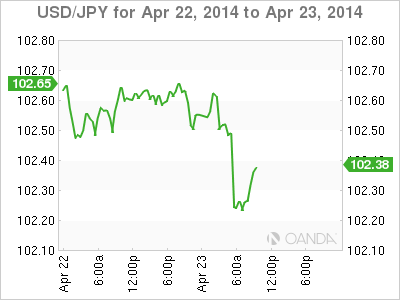
The USD/JPY has posted modest losses in Wednesday trade, as the pair remains in the mid-102 range early in the North American session . In Wednesday releases, the highlight of the day is New Home Sales. The markets are expecting a stronger reading in March. The lone Japanese event, Corporate Services Price Index, will be released later in the day.
Japan's trade deficit ballooned in March, jumping to -1.71 trillion yen, well above the estimate of -1.27 trillion. Besides weighing on the yen, the weak figure has raised speculation that the Bank of Japan may have to step in with further easing, as the economy has softened. Consumer consumption could drop as the recent sales tax hike weighs on consumers, and the BOJ could be forced into action as early as June or July. As well, China has been experiencing a slowdown, which is bad news for Japanese exports.
US Existing Home Sales edged lower in March, dropping to 4.59 million, down from 4.60 million a month earlier. However, it did beat the estimate of 4.57 million, marking the first time that the indicator has beaten the forecast since August. There was also good news form the manufacturing sector, as the Richmond Manufacturing Index jumped to 7 points, crushing the estimate of 0 points.
The markets haven't reacted to events in Ukraine so far, but that could change if the violence in the east of the country worsens. Russian President Vladimir Putin has threatened to act on his "right" to invade Ukraine, and has also given the country an ultimatum regarding its gas debt. The gas supply from Russia to western Europe is in danger, and if the situation spills out of control, we could see a sharp response from the markets. US Vice-President Joe Biden is in Kiev for a symbolic visit. The West doesn't have many cards to play against Russia, so every move by Putin will be scrutinized and could impact on the markets.
USD/JPY for Wednesday, April 23, 2014

USD/JPY April 23 at 13:10 GMT
USD/JPY 102.32 H: 102.69 L: 102.17
USD/JPY Technical
| S3 | S2 | S1 | R1 | R2 | R3 |
| 99.57 | 100.00 | 101.19 | 102.53 | 103.07 | 104.17 |
- USD/JPY is lower in Wednesday trade.
- The pair is testing resistance at 102.53, which has seen action all week long. There is stronger resistance at 103.07.
- 101.19 is providing strong support.
- Current range: 101.19 to 102.53
Further levels in both directions:
- Below: 101.19, 100.00, 99.57 and 98.97.
- Above: 102.53, 103.30, 104.17, 105.70 and 106.85.
OANDA's Open Positions Ratio
The USD/JPY ratio is pointing to gains in short positions in Wednesday trading. This is consistent with the pair's movement, as the yen as gained ground. The ratio is made up of a strong majority of long positions, indicating trader bias towards the dollar reversing directions and moving upwards.
The yen continues to trade at high levels, but the US dollar finds itself under pressure on Wednesday. USD/JPY edged lower in the European session.
USD/JPY Fundamentals
- 13:45 US Flash Manufacturing PMI. Estimate 56.2 points.
- 14:00 US New Home Sales. Estimate 455K.
- 14:30 US Crude Oil Inventories. Estimate 2.6M.
- 23:50 Japanese Corporate Services Price Index. Estimate 0.8%.
