As North American traders woke up this morning, they were greeted by a number concerning signs out of Europe. Most importantly, sovereign debt yields are surging across periphery Europe, raising fears of a 2010-esque panic. At the same time, US Treasury yields have dropped below the key psychological 2.00% level, global equity markets are on the back foot, and Gold prices are continuing to grind higher, all classic signs of risk aversion in the markets.
For traders, Monday already feels like it was weeks ago…and in some way it is, as many markets have move more in the past few days as they did in the previous few months. Nonetheless, the calendar tells us it was just three days ago when we highlighted the potential for more weakness in USD/JPY and stated that, “until a [bullish] signal emerges, the path of least resistance for USD/JPY will remain to the downside” (see “USD/JPY: Marching to the Beat of its Own Drummer” for more).
One of the biggest factors supporting the yen this week has been a massive unwind of the global carry trade. Many carry trades are funded by selling low-yielding yen and buying higher-yielding currencies; when traders become scared, they have to unwind these trades, driving down higher-yielding currencies and pushing the yen higher. As a result, traditional carry trade currencies like AUD/JPY and NZD/JPY have been pounded, and the yen has even strengthened against its safe haven rival, the US dollar.
Technical View: USD/JPY
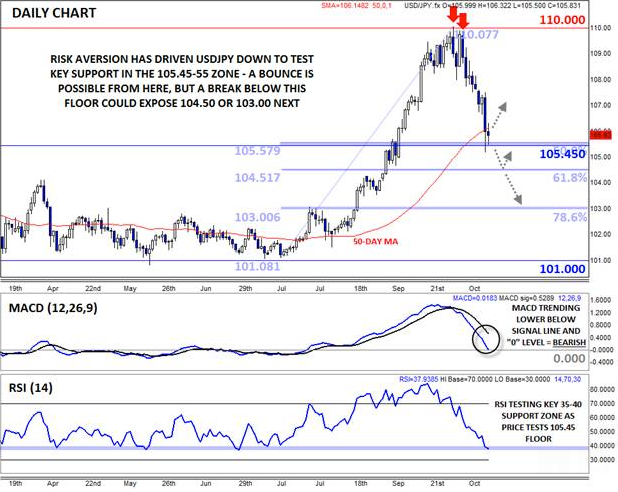
This week’s drop in USD/JPY has left the pair at a critical crossroads. In the midst of yesterday’s panic, the pair briefly ticked below the 105.45 level, which represents previous-resistance-turned-support from the January peak, as well as the 50% Fibonacci retracement of the July-October rally. The secondary indicators have also taken a sharp turn for the worse: the MACD indicator is trending sharply lower below its signal line and is about to cross the “0” level, showing a shift to outright bearish momentum, while the RSI is testing multi-month lows in the 35-40 zone, and a break below this key area would represent a particularly bearish signal.
If the massive wave of global risk aversion subsides in the coming days, the key 105.45 level may provide a durable floor for rates in the coming days; even a brief dip to the 61.8% Fibonacci retracement at 104.50 would leave the longer-term bullish bias intact. On the other hand, if traders in other markets continue to panic and USD/JPY breaks 104.50, the pair could soon revisit the low end of its Q1-Q2 range, with the next support level coming in at 103.00 even.

Source: FOREX.com
For more intraday analysis and market updates, follow us on twitter (@MWellerFX and @FOREXcom).
