Prices suddenly shot up after the close of Tokyo Stock Exchange, sending USD/JPY over the 100.0 line and more importantly crossing the highs of early Monday morning. Unfortunately, price remain below Friday’s swing high of 100.2, with the rally losing steam before the key level has been tagged. The reason for the rally is not immediately obvious, with the only news during the period being Japan Machine Tool Orders having declined 1.8% on a Y/Y basis. This may seem bearish but is actually a huge improvement from previous month’s -12.2%, and the best print since June 2012. That being said, it is highly unlikely that this is the main reason USD/JPY went up by 50 pips within 2 hours as this number is not heavily followed and tend not have huge volatility following its announcement traditionally. A stronger news that could have impacted risk sentiment more significantly would be the Chinese Industrial Production and Retail Sales numbers, both of which are better than expected. However, that was announced 30 mins before the start of the rally, and the price action during the hour was actually bearish instead of bullish. Looking across all other USD pairs, there seems to be some slight USD appreciation across board, but the magnitude is way smaller compared to USD/JPY, hence suggesting that the broad USD strengthening was actually due to the spilling over of USD/JPY rally as oppose to USD strength driving USD/JPY higher. By process of elimination, we are left with speculative action as the only reason why the sudden rally occurred.
Hourly Chart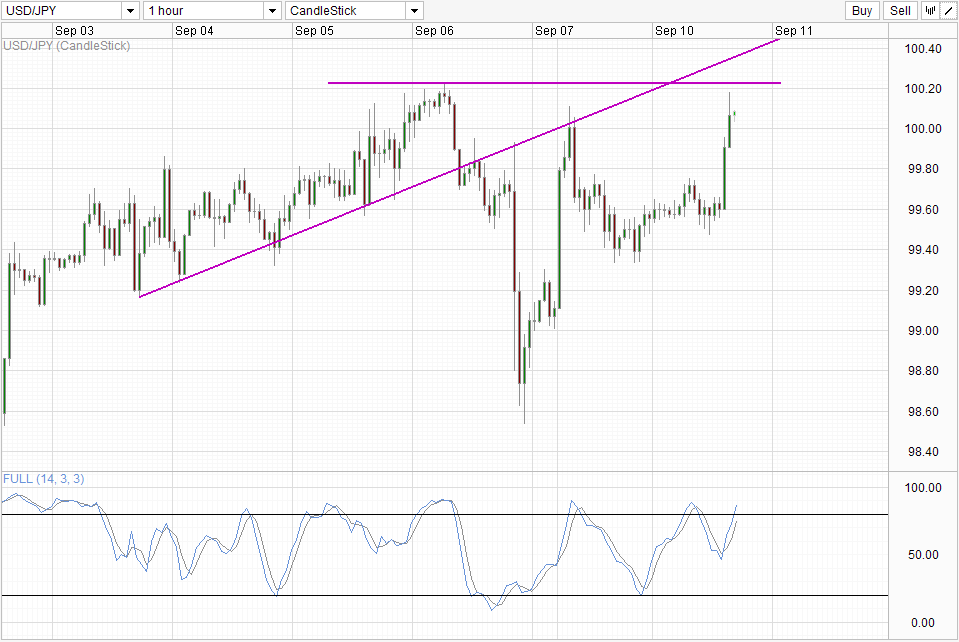
If the conclusion is correct, then the chances of prices breaking 100.20 becomes lower, as there isn’t any fundamental reason for further rally. Stochastic readings suggest that current prices are overbought as well, lowering the likelihood of a bullish push even further. If 100.20 indeed holds, 99.4 – 99.6 opens up as the next level of support with a further bearish target at 98.5.
Weekly Chart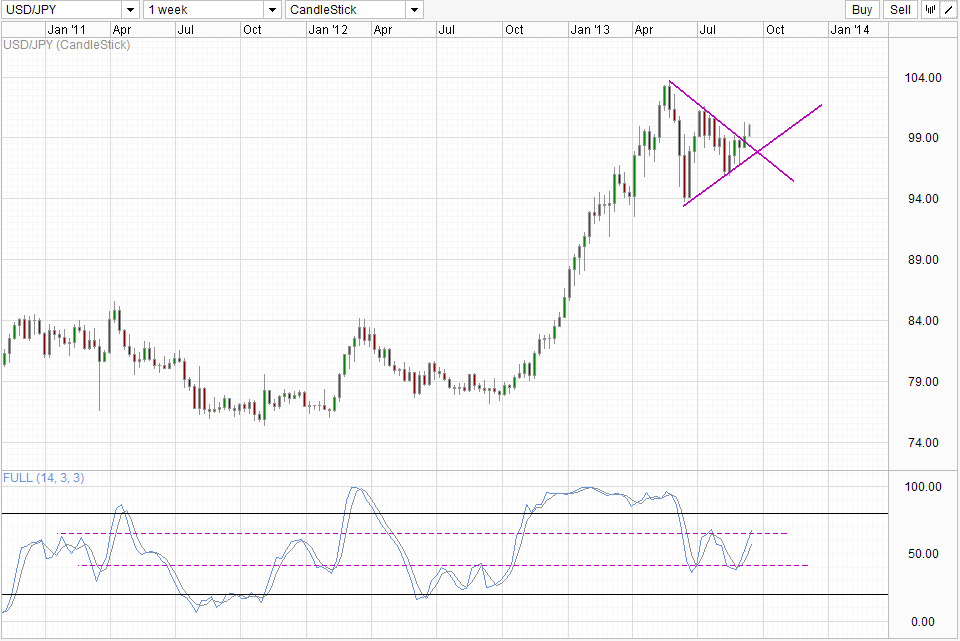
Weekly Chart does not agree with the short-term outlook, with prices looking at a bullish breakout from the Triangle/Pennant that may bring us to 104.0 or perhaps even further. Stochastic readings favors a move higher, but in order to affirm the bullish signal that did not start from the Oversold region, the Stoch curve would need to push above the recent peak. The same could be said about price which should ideally push above 101.50 which is the swing high back in July to affirm current breakout which should give us at the very least a Gartley pattern if not a fresh bullish push above 104.0 if the Pennant pattern proves to be correct.
Original post
- English (UK)
- English (India)
- English (Canada)
- English (Australia)
- English (South Africa)
- English (Philippines)
- English (Nigeria)
- Deutsch
- Español (España)
- Español (México)
- Français
- Italiano
- Nederlands
- Português (Portugal)
- Polski
- Português (Brasil)
- Русский
- Türkçe
- العربية
- Ελληνικά
- Svenska
- Suomi
- עברית
- 日本語
- 한국어
- 简体中文
- 繁體中文
- Bahasa Indonesia
- Bahasa Melayu
- ไทย
- Tiếng Việt
- हिंदी
USD/JPY: Pushing Above 100.0 Without Just Cause
Published 09/10/2013, 06:36 AM
Updated 07/09/2023, 06:31 AM
USD/JPY: Pushing Above 100.0 Without Just Cause
Latest comments
Install Our App
Risk Disclosure: Trading in financial instruments and/or cryptocurrencies involves high risks including the risk of losing some, or all, of your investment amount, and may not be suitable for all investors. Prices of cryptocurrencies are extremely volatile and may be affected by external factors such as financial, regulatory or political events. Trading on margin increases the financial risks.
Before deciding to trade in financial instrument or cryptocurrencies you should be fully informed of the risks and costs associated with trading the financial markets, carefully consider your investment objectives, level of experience, and risk appetite, and seek professional advice where needed.
Fusion Media would like to remind you that the data contained in this website is not necessarily real-time nor accurate. The data and prices on the website are not necessarily provided by any market or exchange, but may be provided by market makers, and so prices may not be accurate and may differ from the actual price at any given market, meaning prices are indicative and not appropriate for trading purposes. Fusion Media and any provider of the data contained in this website will not accept liability for any loss or damage as a result of your trading, or your reliance on the information contained within this website.
It is prohibited to use, store, reproduce, display, modify, transmit or distribute the data contained in this website without the explicit prior written permission of Fusion Media and/or the data provider. All intellectual property rights are reserved by the providers and/or the exchange providing the data contained in this website.
Fusion Media may be compensated by the advertisers that appear on the website, based on your interaction with the advertisements or advertisers.
© 2007-2024 - Fusion Media Limited. All Rights Reserved.