EUR/USD
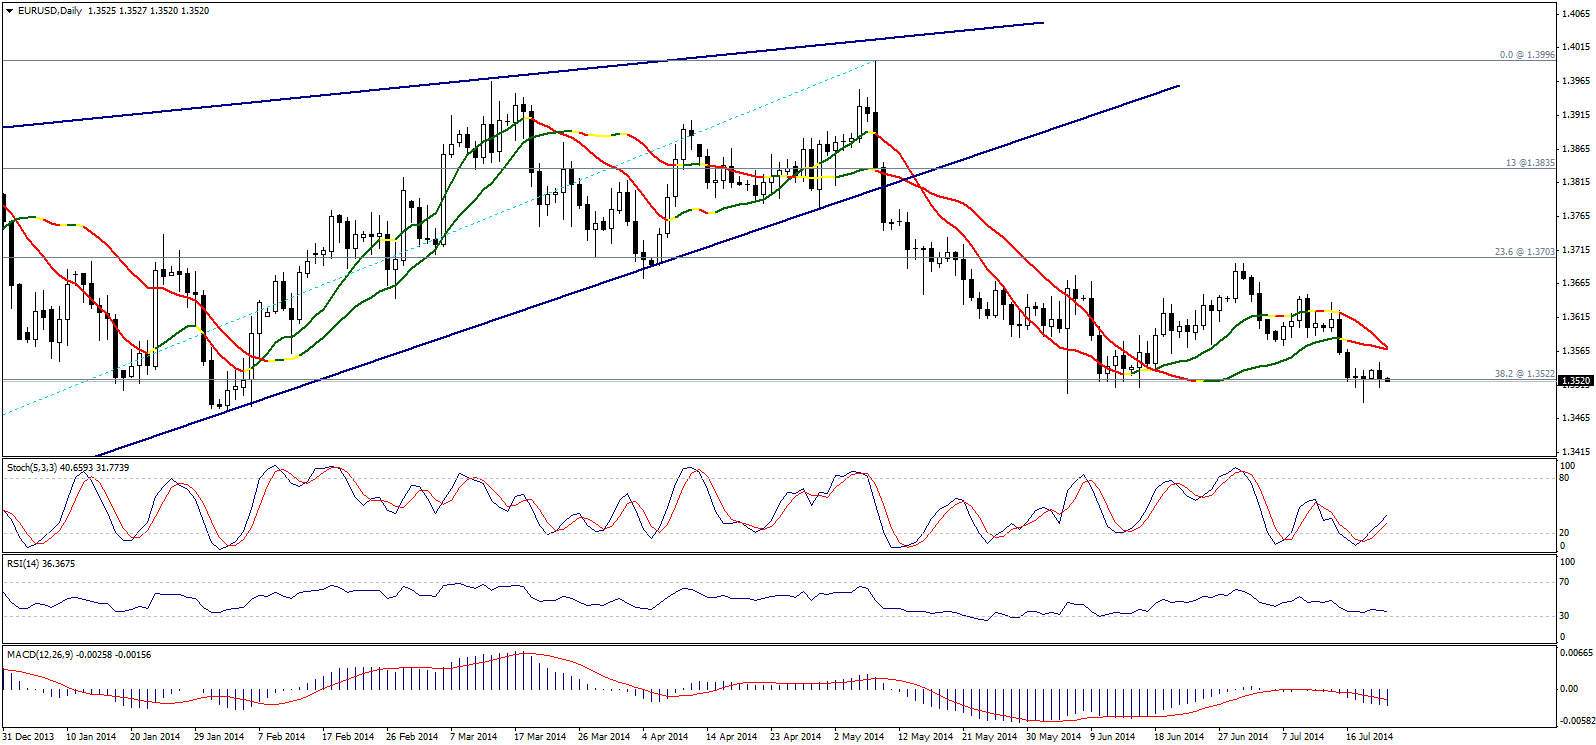
Linear Regression Indicators almost crossed over negatively, whereas Linear Regression Indicator 34 is attempting to negatively crossover with Linear Regression Indicator 55 as showing on graph. MACD and RSI are negative too. All these catalysts forces us to think that the pair will extend its downside move attempting to confirm breaking 1.3520 that represent an interval intraday and for the rest of the week.
Stochastic tends to be positive but is trading below line 50, and stabilizing below 1.3520 leads later to achieving a negative singal on the indicator. From the upside, stabilizing at 1.3580 keeps the negative pressure on the pair.

GBP/USD
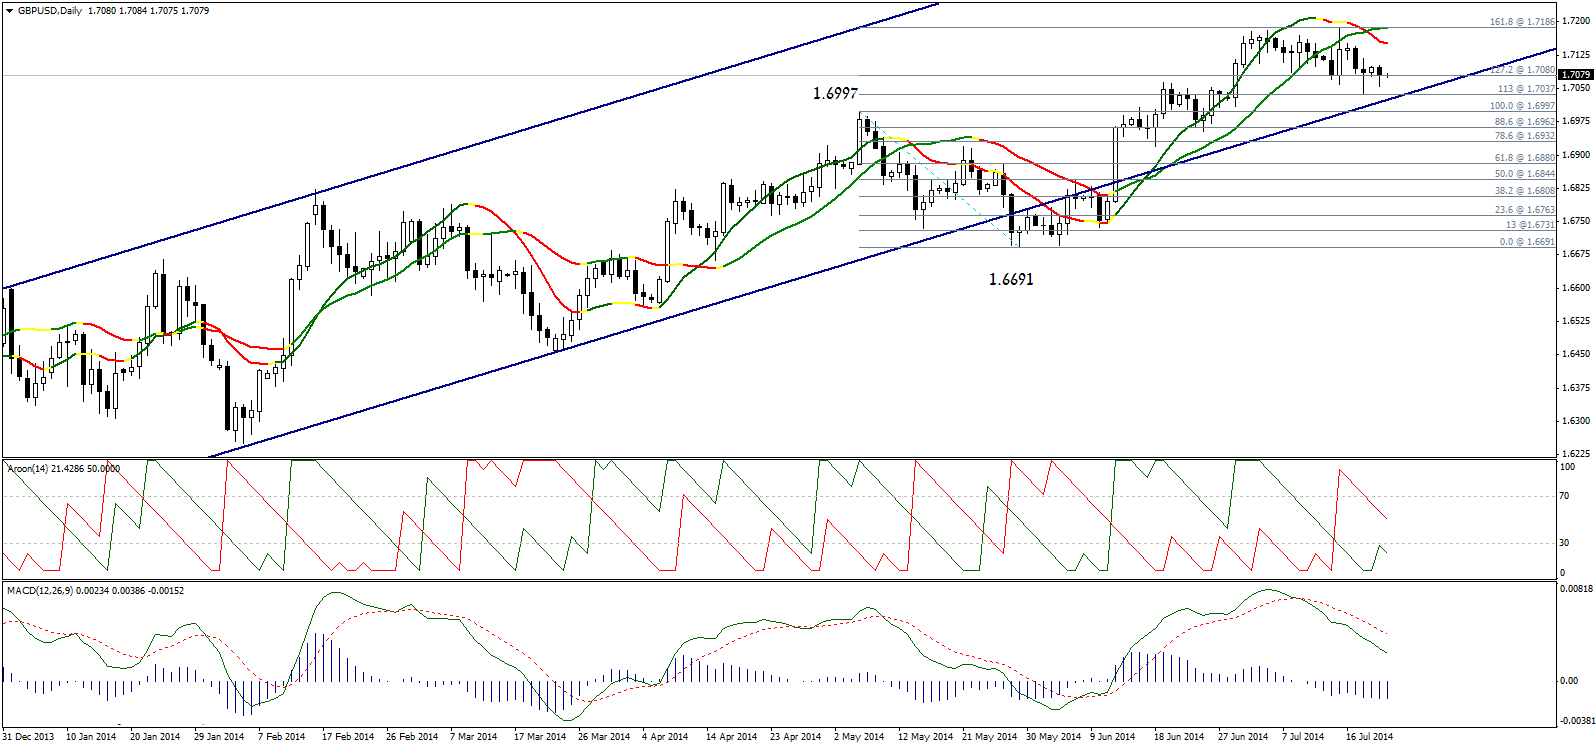
The pair is trading slightly to the downside accompanied by the negativity of MACD Indicator. But AROON is showing weakness in the downside move strength due to failing to achieve daily closing below 1.7080 represented in 127.2% correction.
Levels 1.7080 represent an intraday interval for today and trading below it favors further bearishness. Linear Regression Indicator 34 resides at 1.7150 and is trading negatively forcing us to think that trading below 1.7150 keeps the bearish possibility valid in the upcoming period.

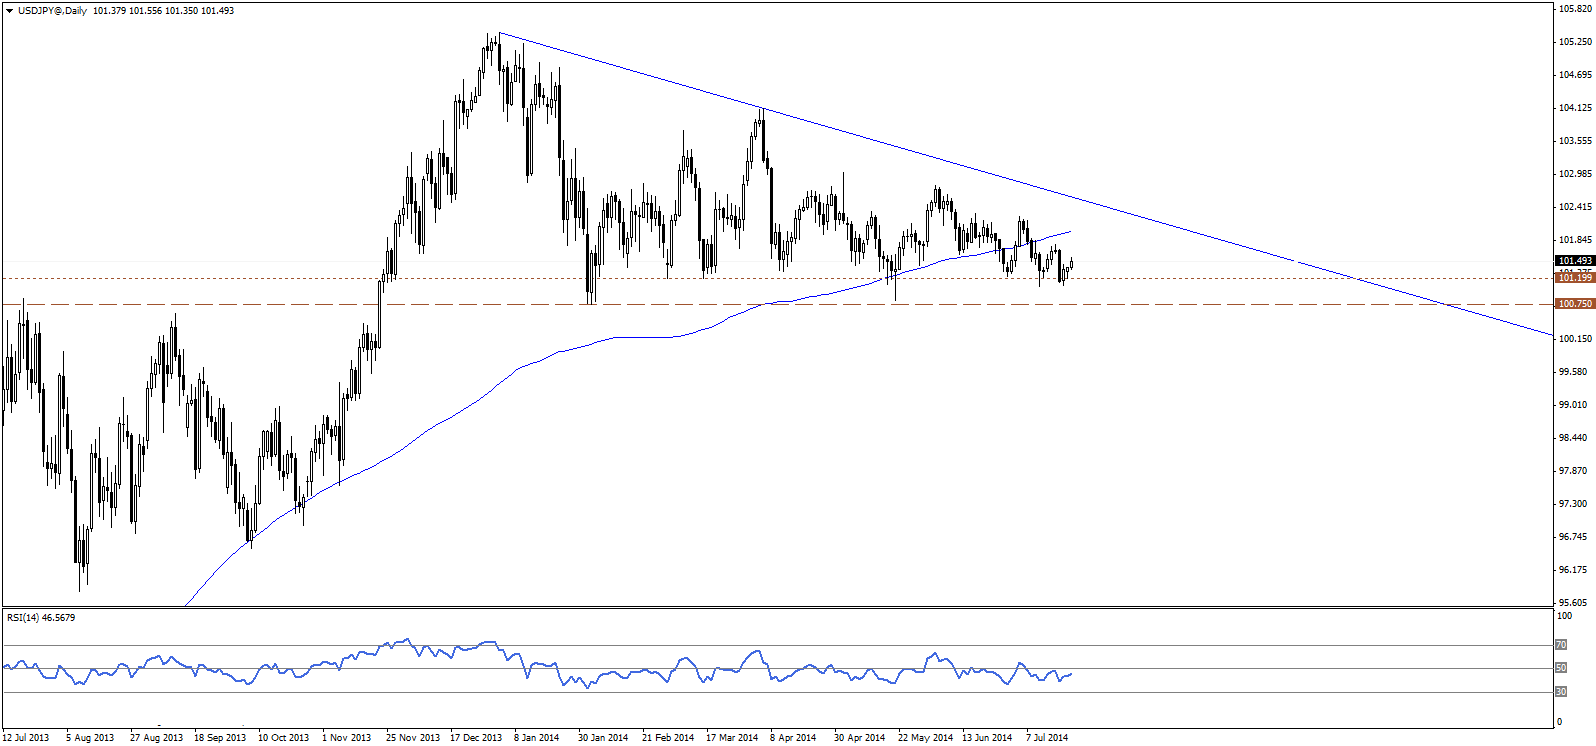
The USD/JPY regains bullish momentum after testing 101.20 support level, which remains the main downside barrier and key support area among 101.20-100.75, that keeps the long term bullish trend intact. Only a break below that support area with clear stability would signal a bearish reversal, and reverses the outlook to bearish. Accordingly, we hold onto our bullish expectations for the pair in the near term.

USD/CHF
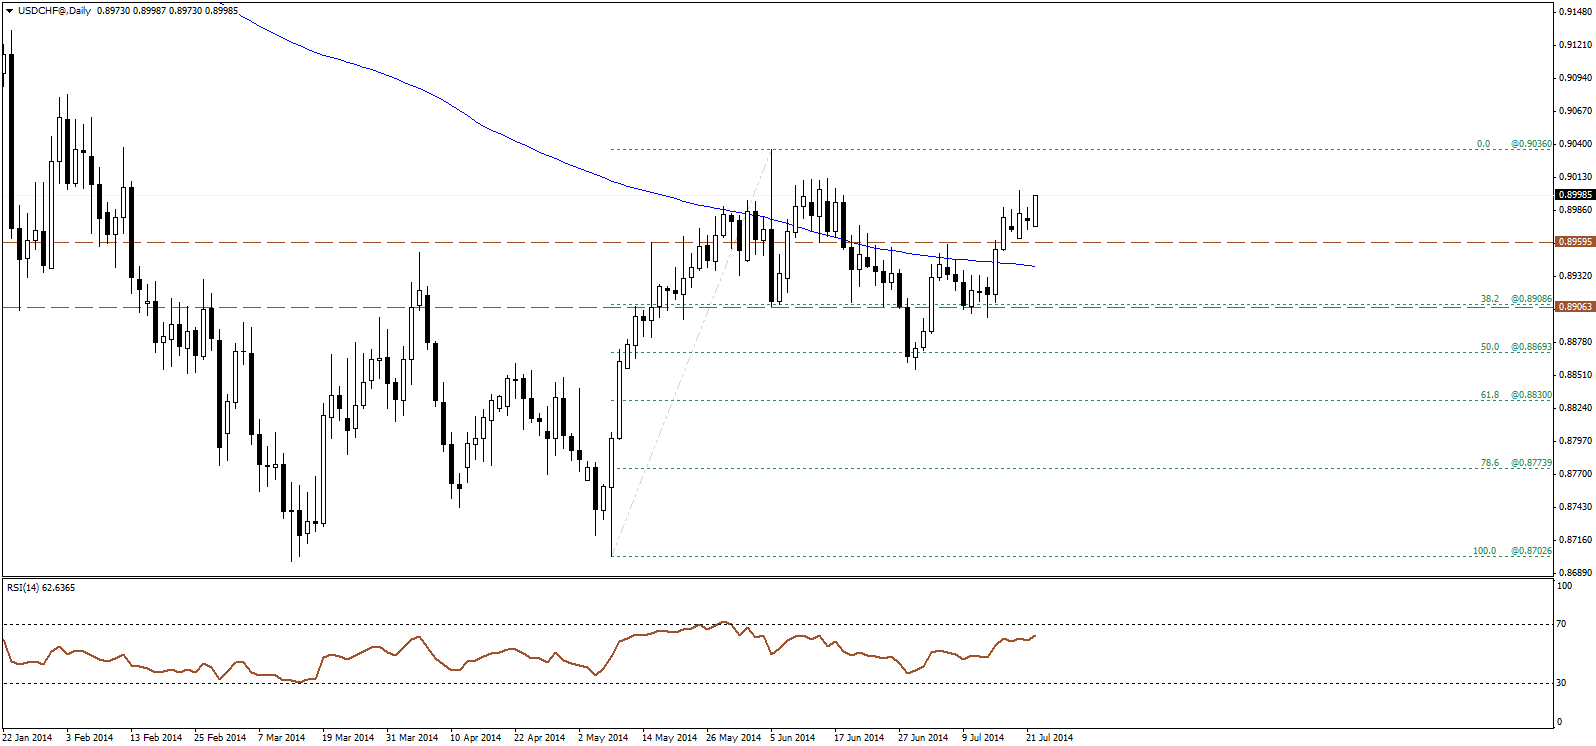
The pair is pushing higher, trading above the key broken resistance at 0.8960 and the 200-days SMA., where breaking above 0.8960 resistance confirmed the strong bullish bias, which came following an earlier break above the 200-days SMA. Both signals indicate renewed bullish pressures and further upside is likely, targeting mainly the latest major swing high at 0.9035.

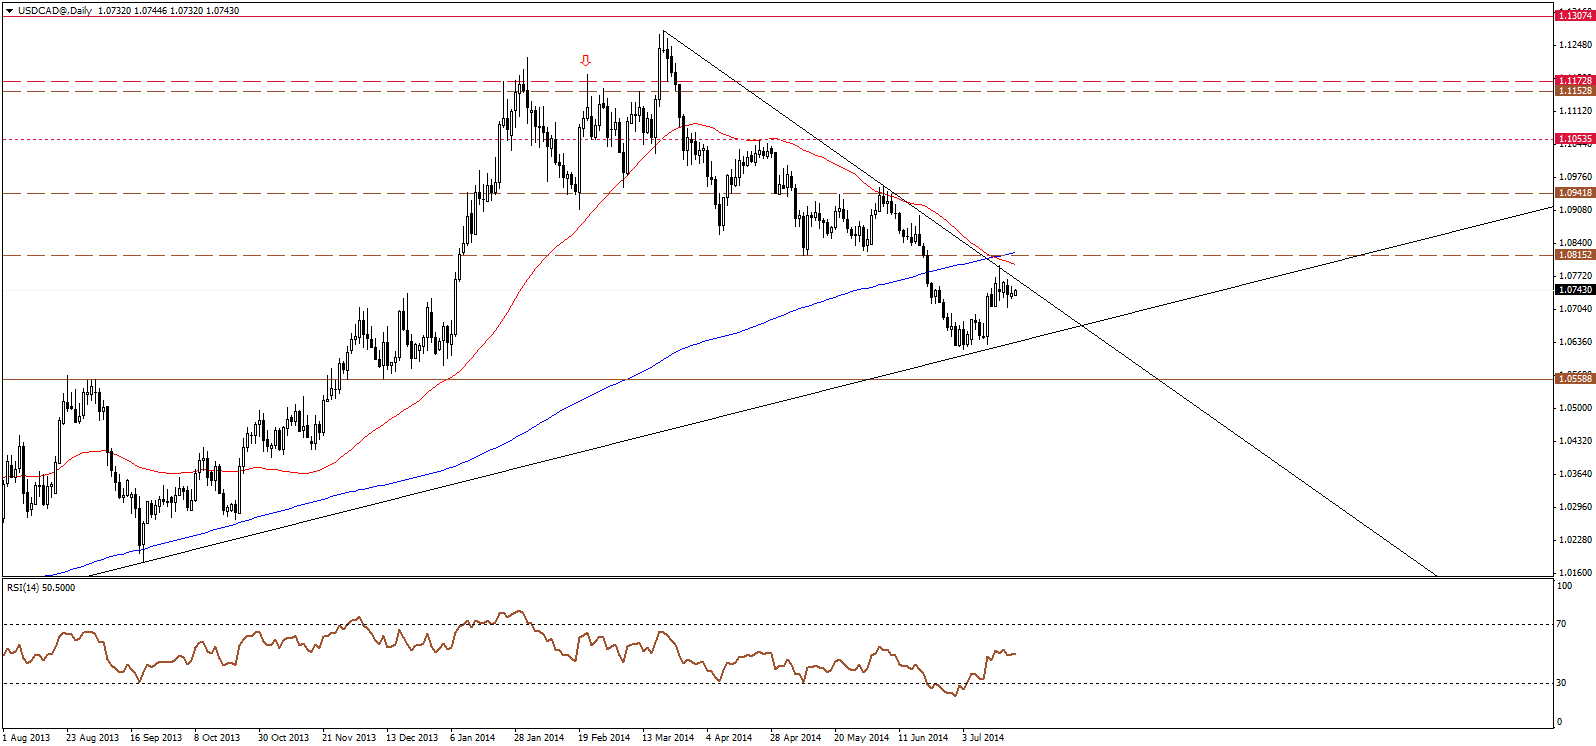
The USD/CAD maintains fluctuations below the main descending resistance for the overall bearish wave that started from 1.1277 high, and below the cluster of moving averages and 1.0815 horizontal resistance, and that favors the bearish resumption scenario.

AUD/USD
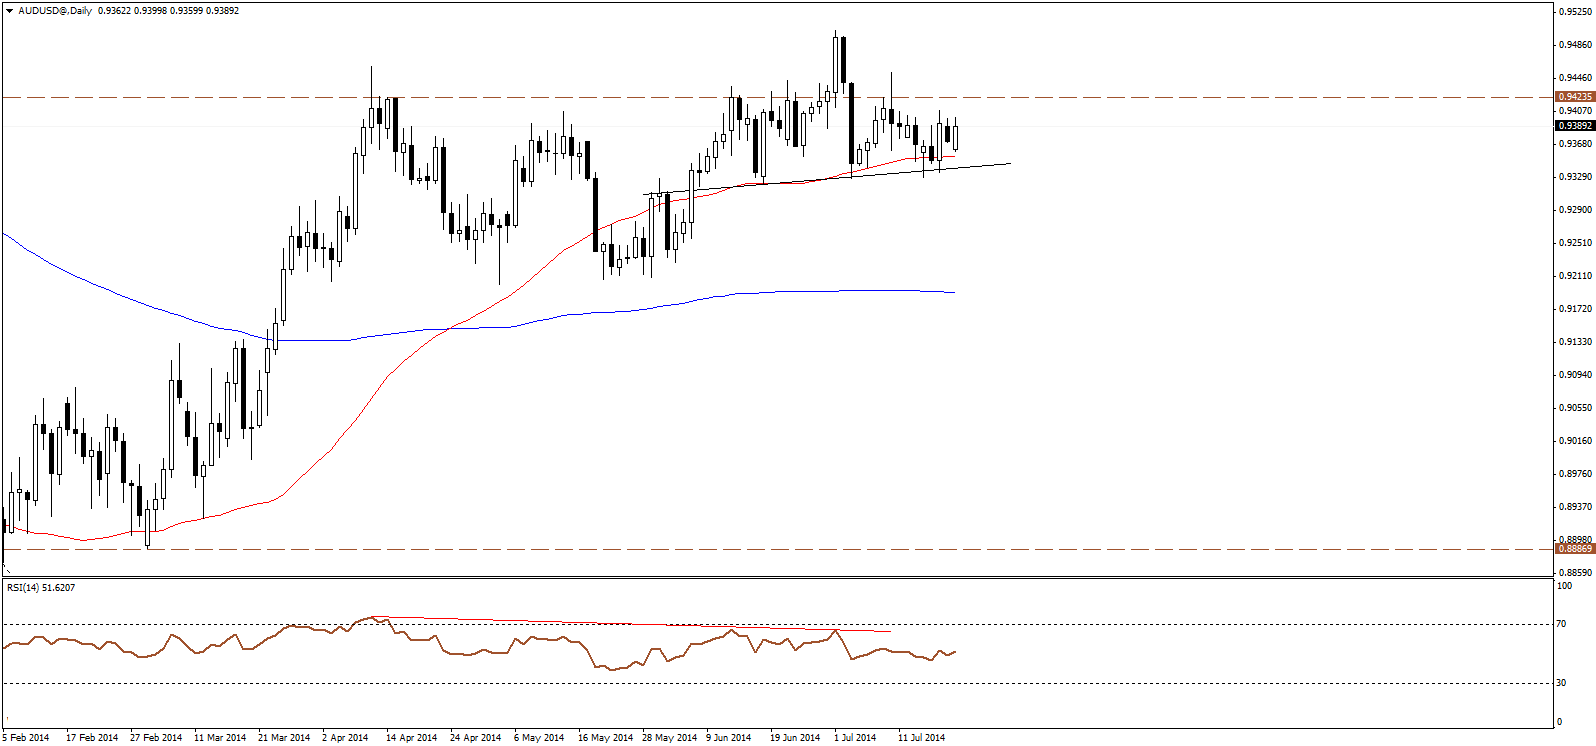
The AUD/USD is moving higher again, as price maintains trading within the overall bullish trend, and above the key neckline for a head and shoulders pattern in addition to the 50-days SMA, and that favors the bullish scenario. Only a break below the neckline of the pattern will threaten for a bearish reversal.

NZD/USD
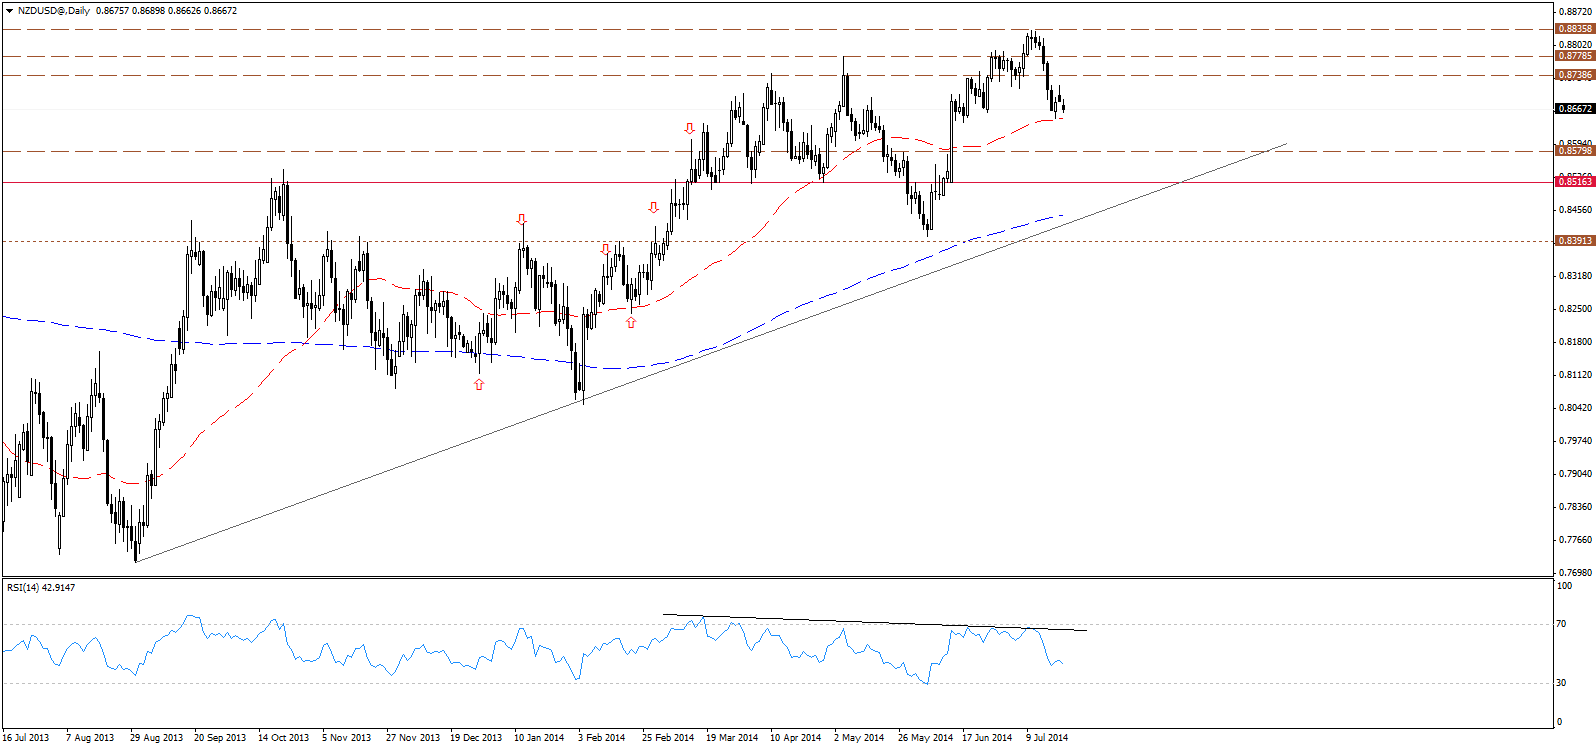
The NZD/USD resumed the bearish bias yesterday, approaching the 50-days SMA support once again. The price has broken some short term key technical support levels at 0.8740 and 0.8715 and holding below these levels would keep the bearish bias favored, supported by the bearish divergence one RSI momentum indicator. And a break below the 50-days SMA would confirm further downside.

