Equity markets remained nervous yesterday, with US indices closing towards the day’s lows after an attempted rally earlier in the session. It is again worth noting that USDJPY has survived a test of the key FIbonacci retracement towards 106.65 and has bounced reasonably overnight – with 107.40/50 as the first important hurdle that would encourage the bulls if surpassed.
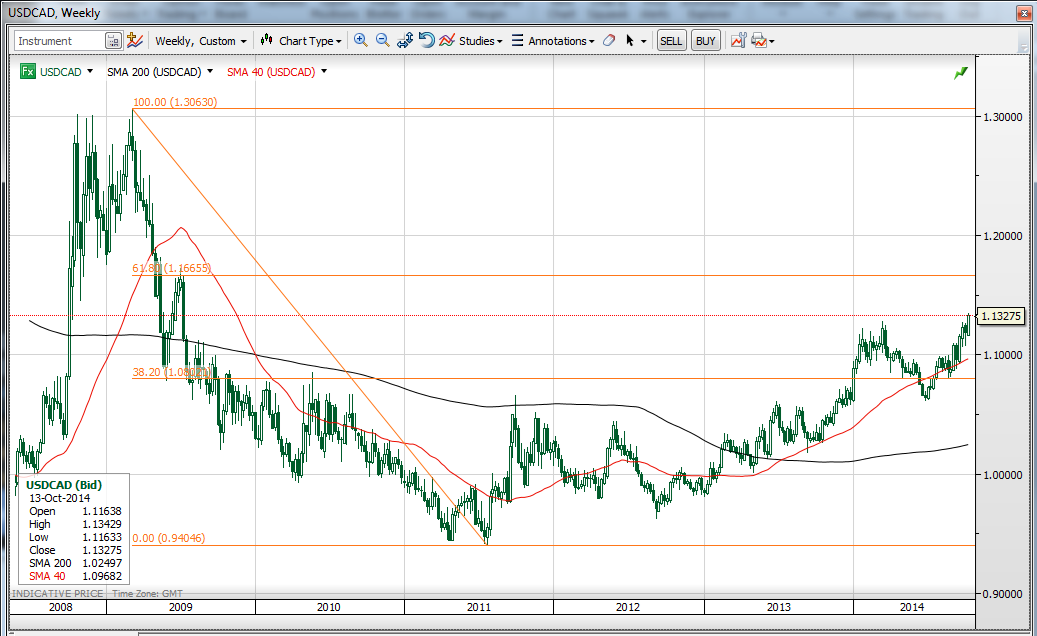
The steep fall in crude oil turned downright parabolic yesterday, with major crude grades falling almost four dollars a barrel. This was the straw that broke the 1.1278 resistance level’s back in USDCAD and took the pair to its highest level in over five years. The pair may be ready for a trip to 1.150.
Chart: USDCAD
USDCAD blasted to fresh 5-year highs as crude oil prices crumbled. The next target may be something like a round number of 1.1500, or the market may get a bit more technical and look for something like the 61.8% retracement of the highs above 1.3000 posted during the global financial crisis, which comes in around 1.1667. In any case, as the pair has broken free of the previous range, the upper bound of that old range at 1.1278 is now support.

EURNOK also blasted higher, where NOK longs were already a bit under pressure from a recent low CPI reading, and the pair closed above a local range resistance level at 8.30 on crumbling oil prices, which will quickly affect the guidance from Norges Bank in the future. Note that yesterday’s close was also above the 200-day moving average down at 8.2725. The range highs near 8.500 are the next focus.
Copper prices rallied sharply and Australian mining shares have bounced hard from recent lows, helping the AUD to rally versus its commodity currency peers. The key AUDUSD has gone quiet for three whole weeks now, as everyone looks for either signs of a squeeze (a move back above 0.8800 raises the risk) or a continuation of the downtrend with fresh lows below 0.8650. The trend is clear, and an eventual break lower is certainly the preferred scenario, but the path to that scenario is the uncertainty.
Recall, for example, the great EURUSD rally that got underway in 2002, there was an enormous move early in the year that consolidated for all of five months before the continuation of the trend set in late in the year. Note that we posted a sub-0.8900 reading all the way back in August of last year – this has been a hesitant and reluctant bear market at times, with large backfills, but I suspect once we break below the 0.8650 area, the slide could pick up renewed energy toward 0.8000 and possibly beyond.
Looking ahead
It is another important day for sterling, with key jobless claims and earning and employment data on tap at the usual 08:30 GMT. Yesterday’s much weaker than expected inflation figures for September saw the bottom drop out for sterling, and EURGBP up through the 0.7900 resistance. To get an idea of how rapidly the market is pricing out Bank of England rate rises, note that the 2-year rate is down almost 30 basis points from its post-Scottish referendum highs.
Strong data today could see a bounce, as the BoE debate is centred most intently on the debate over slack in the economy and employment and wage growth, more than it is on inflation.
The US data today is the first interesting data point in many trading days that have been ruled by general fear and it will be interesting to see how the market reacts. Look for especially strong data to see USDJPY pulling sharply higher.
Note that the European Central Bank chief Mario Draghi is on the loose today, with the odd comment to press always a risk for ad hoc euro volatility.
Economic Data Highlights
Australia Oct. Westpac Consumer Confidence Index out at 94.8 vs. 94.0 in Sep.
China Sep. PPI out at -1.8% YoY vs. -1.6% expected and -1.2% in Aug.
China Sep. CPI out at +1.6% YoY vs. +1.7% expected and +2.0% in Aug.
Japan Aug. Final Industrial Production revised down to -3.3% YoY vs. -2.9% original estimate and -0.7% in Jul.
Upcoming Economic Calendar Highlights (all times GMT)
Eurozone ECB’s Draghi to Speak in Frankfurt (0700)
Norway Sep. Trade Balance (0800)
UK Sep. Jobless Claims Change (0830)
UK Aug. Average Weekly Earnings (0830)
UK Aug. Employment Change (0830)
Switzerland Oct. Credit Suisse ZEW Survey (0900)
US Oct. Empire Manufacturing (1230)
US Sep. Advance Retail Sales (1230)
US Sep. PPI (1230)
Canada Sep. Existing Home Sales (1300)
Canada Sep. Teranet/National Bank Home Price Index (1300)
US Aug. Business Inventories (1400)
Eurozone ECB’s Nuoy to Speak (1530)
UK BoE’s Weale to Speak (1700)
US Fed releases Beige Book (1800)
Eurozone ECB’s Draghi to Speak (1800)
New Zealand Oct. ANZ Consumer Confidence (0000)
