By Pinchas Cohen
We interrupt our regularly scheduled series of the 10 sectors that make up the S&P 500 Index, to take advantage of an extraordinary event.
The release of the new iPhone was to be Apple’s gala event of the decade, but industry reactions suggest Tim Cook failed to regenerate the big-bang Steve Jobs created 10 years ago, and traders quantified this disappointment with letting down the stock and bucking the trend, as all three major US averages made record closes.
Apple (NASDAQ:AAPL) initially gapped up 0.65 percent and extended its jump to 1.50 percent ahead of the event, anticipating being wowed. When investors found themselves underwhelmed they overwhelmed the exchange with sell orders, sending the price into a 3.13 percent freefall in the one hour and 6 minutes, from 13:56 EDT to 15:02 EDT.
Dip buyers took advantage, and/or short coverings took a profit, paring losses, to settle at 0.40 percent. To appreciate this number requires a benchmark. We’ll provide you with several:
- The S&P 500 Index gained 0.34 percent, even after having been slowed down by Apple’s 3.94 percent weight on the index – as it registered a back-to back record high, record close, as well as close only 24 points below the high, in a sign of trader decisiveness.
- The NASDAQ 100 advanced 0.25 percent, even after having been dragged down by Apple’s whopping 12.29 percent weighing on the index; the triple weight on the NASDAQ 100 weighed more heavily on the average than on the S&P 500 Index.
- Finally, even the specific Technology sector on the S&P 500 climbed 0.24 percent, even after Apple’s rock-heavy 15.38 percent weighing on the sub-index.

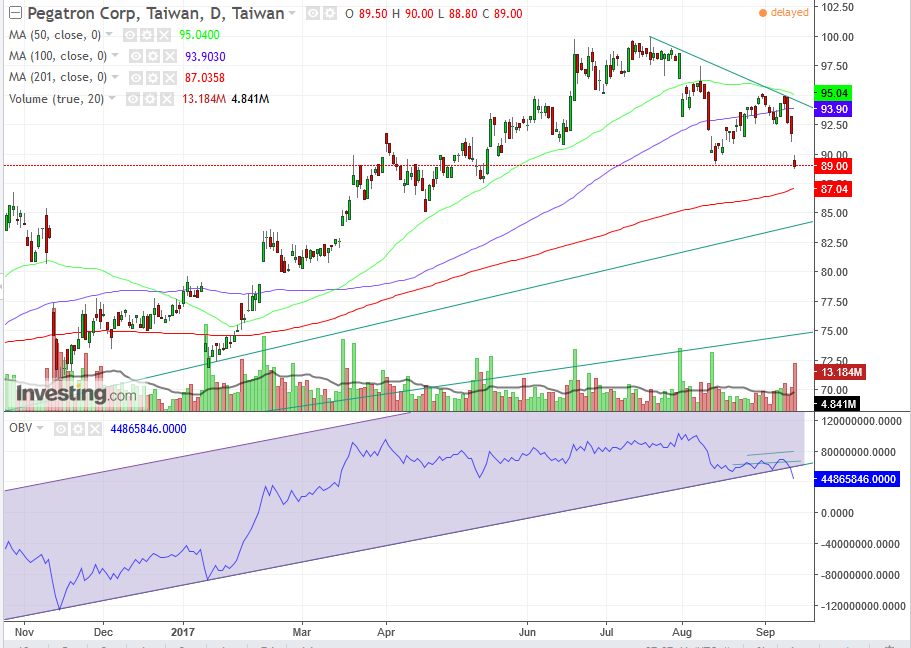
Another way with which to measure yesterday’s impact on Apple is looking at its suppliers. If an index is made up of its individual stock components, it could be argued that investors’ perception of Apple is made up, in part, by its suppliers. Yesterday, some of Apple’s biggest suppliers took a hit, and today they took another hit. Pegatron Corp (TW:4938), for example, may sound like a villainous transformer, but yesterday it lost 1.10 percent and today it shed an additional 3 percent.
The decline registered a new, second trough – backed up with the highest selling-volume since February which completes a reversal from an uptrend to a downtrend. Moreover, the On-Balance Volume indicator, considered to distinguish between smart money (intuitional investors) and less sophisticated, less resourceful, retail traders, broke the trend since May 2016.

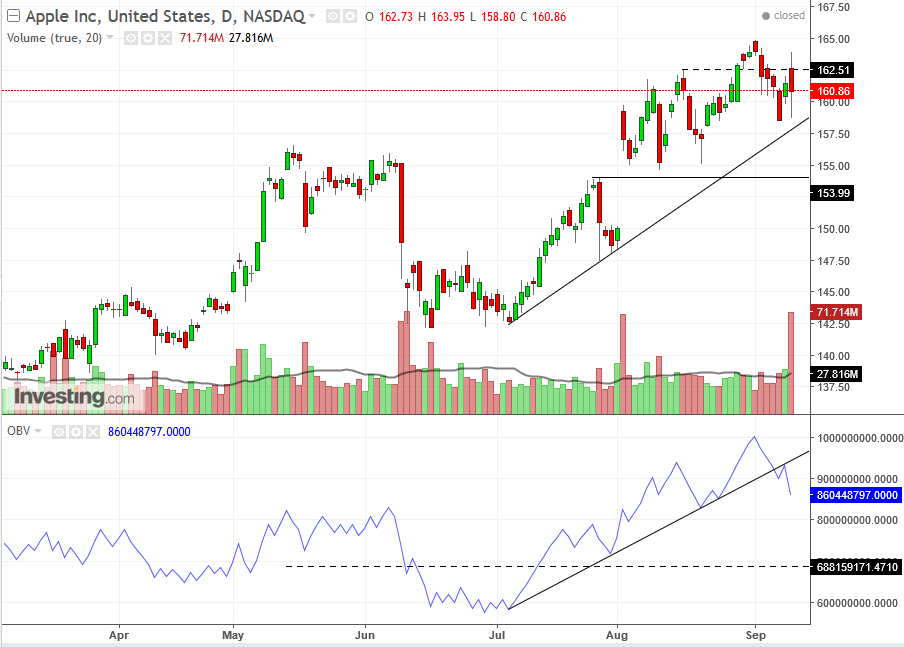
While Apple still trades within an uptrend, it is put to question by its lack of recording a new peak, while its sector and multiple listings made records. The close right on the resistance of the previous, August 16 peak demonstrates further weakness, suggesting the forming of the right shoulder of a H&S top. Like with Pegatron, Apple’s OBV fell below its uptrend line since July 6, retested it with a return-move, and declined further.
Yesterday’s selling volume was as bad as that of June 12. The only difference is that compared to yesterday’s $162.51 close, June 12 session closed at $145.42, 10.5 percent less, and then it declined another 2.10% within four sessions.
The $154 bottom of the August 1 gap is the crucial support. Should it fall below, it will have already fallen below the uptrend line and would suggest a top, with a minimum further 6 percent decline.
Trading Strategies
Conservative traders would wait on a short until it penetrates 3 percent below the $154 support, with a stop-loss above $154, allowing a minimum 1:3 risk-reward trade management.
Moderate traders would wait on a short for a 2 day and 1 percent close beneath the uptrend line.
Aggressive traders would short now, with a stop-loss above the $165, September 1 high and allow for a minimum profit of 3 times the risk. A decisive break below the uptrend line, including 2 periods and 1%, would suggest a further decline to retest the 154 support. That break would imply the 6 percent decline described above.
Amateur traders would hear the headlines and short from the hip, without any understanding of risk or a trade plan, and are 100 percent guaranteed to lose all their trading capital, sooner or later.
