Talking Points
Foreign Exchange Price & Time at a Glance

Charts Created using Marketscope – Prepared by Kristian Kerr
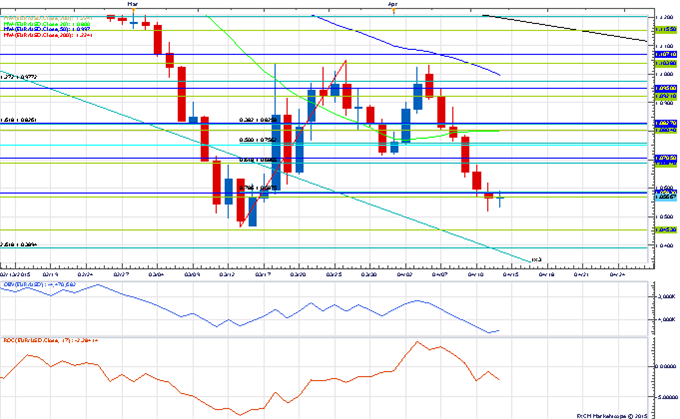
- EUR/USD broke below the 78.6% retracement of the late-March range yesterday
- While below 1.0830 our near-term trend bias is lower in the euro
- The 127% extension of the 2005-2008 adavance around 1.0440 looks to be the next major pivot for the rate
- A minor turn window is eyed around the end of the week
- Interim resistance is seen around 1.0685, but only a move through 1.0830 would turn us positive on the single currency
EUR/USD Strategy: Square.
Instrument | Support 2 | Support 1 | Spot | Resistance 1 | Resistance 2 |
EUR/USD | *1.0440 | 1.0520 | 1.0565 | 1.0585 | 1.0685 |

Charts Created using Marketscope – Prepared by Kristian Kerr
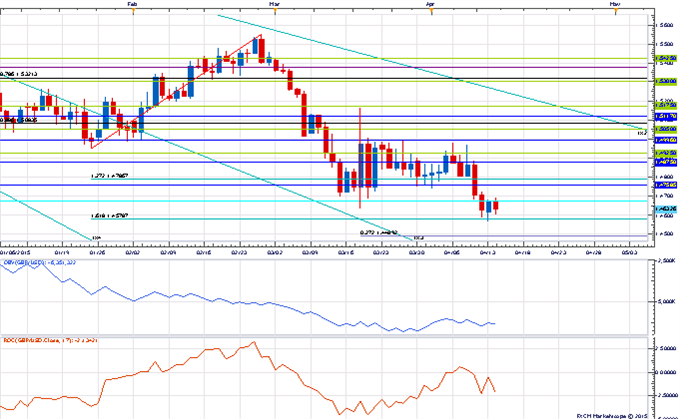
- GBP/USD fell to its lowest level in almost 5 years on Monday before finding support near the 161.8% extension of the January to February advance near 1.4575
- Our near-term trend bias is lower in Cable while below 1.4760
- A move under 1.4575 is now needed to trigger the next leg lower in the rate
- A very minor turn window is eyed here
- A close back over 1.4760 would turn us positive on the pound
GBP/USD Strategy: Like the short side while below 1.4760
Instrument | Support 2 | Support 1 | Spot | Resistance 1 | Resistance 2 |
GBP/USD | *1.4575 | 1.4600 | 1.4630 | 1.4700 | *1.4760 |
Focus Chart of the Day

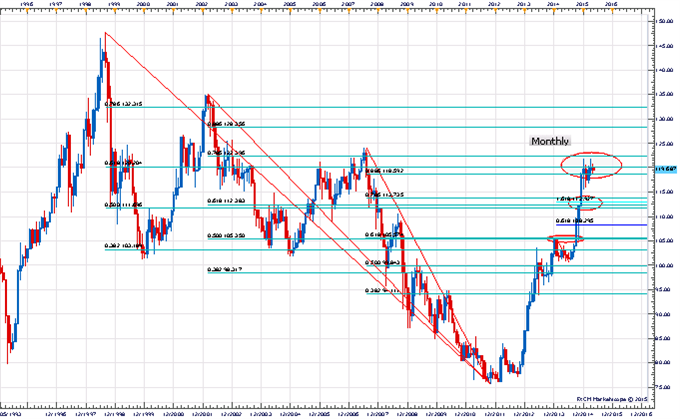
Every now and again we like to step and take a look at where exchange rates stand in the longer-term scheme of things. USD/JPY remains an interesting chart in this context and partially explains the choppy range bound nature of trading in the pair since December. Looking at the monthly chart we can see clear sets of long-term Fibonacci clusters. Last year, for instance, the exchange rate started the year by stalling out around 105.50 which was a nice convergence of the 50% retracement of the 2002-2011 decline and the 61.8% retracement of the 2002-2011 decline. This led to more than two quarters of range trade before the rate finally broke free from the cluster on the back of the surprise BOJ QE announcement late last year. The coiled pent up nature of the market (all time low levels of vol in 2014) saw USD/JPY slice right through the confluence zone around 113.00 to trade to the next cluster between 118.60 and 122.40 where the trend has clearly stalled out over the past few months. Are we getting a repeat of consolidations past? It certainly seems so. As such we suspect USD/JPY will continue to be “dead money” until the 78.6% retracement of the 2002-2011 decline at 122.40 convincingly gives way.
--- Written by Kristian Kerr, Senior Currency Strategist for DailyFX.com
