Get 40% Off
👀 👁 🧿 All eyes on Biogen, up +4,56% after posting earnings. Our AI picked it in March 2024.
Which stocks will surge next?
Unlock AI-picked Stocks

USD/CHF Technical Analysis – Rally Stalls Above 0.88 Figure

Published 04/21/2014, 05:12 AM
Updated 07/09/2023, 06:31 AM

Talking Points:

  • USD/CHF Technical Strategy: Flat
  • Support: 0.8802 (23.6% Fib exp.), 0.8742 (Apr 11 low)
  • Resistance: 0.8839 (38.2% Fib exp.), 0.8869 (61.8% Fib exp.)

The US Dollar rebound against the Swiss Franc has paused to consolidate after prices found support above the 0.87 figure. Near-term resistance is at 0.8839, the 38.2% Fibonacci expansion, with a break above that targeting 50% level at 0.8869. Alternatively, a turn back below the 23.6% Fib at 0.8802 exposes the April 11 lowat 0.8742.

Prices are trading too close to relevant resistance to make a long trade attractive from a risk/reward perspective. On the other hand, the absence of a bearish reversal signal argues against taking up the short side. We will continue to stand aside for now, waiting for an actionable opportunity to present itself.

Confirm your chart-based trade setups with the Technical Analyzer. New to FX? Start Here!

USD/CHF Technical Analysis – Rally Stalls Above 0.88 Figure

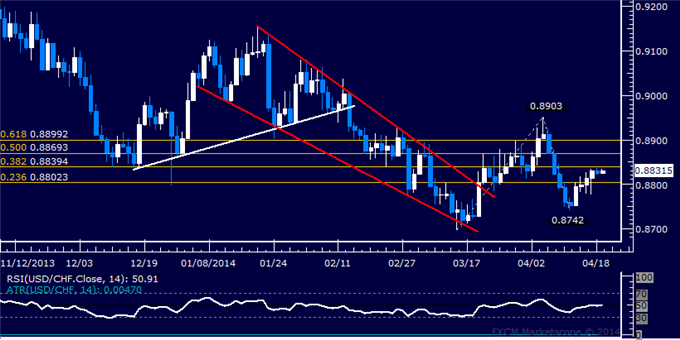
Daily Chart - Created Using FXCM Marketscope 2.0

Original post

Latest comments

Risk Disclosure: Trading in financial instruments and/or cryptocurrencies involves high risks including the risk of losing some, or all, of your investment amount, and may not be suitable for all investors. Prices of cryptocurrencies are extremely volatile and may be affected by external factors such as financial, regulatory or political events. Trading on margin increases the financial risks.
Before deciding to trade in financial instrument or cryptocurrencies you should be fully informed of the risks and costs associated with trading the financial markets, carefully consider your investment objectives, level of experience, and risk appetite, and seek professional advice where needed.
Fusion Media would like to remind you that the data contained in this website is not necessarily real-time nor accurate. The data and prices on the website are not necessarily provided by any market or exchange, but may be provided by market makers, and so prices may not be accurate and may differ from the actual price at any given market, meaning prices are indicative and not appropriate for trading purposes. Fusion Media and any provider of the data contained in this website will not accept liability for any loss or damage as a result of your trading, or your reliance on the information contained within this website.
It is prohibited to use, store, reproduce, display, modify, transmit or distribute the data contained in this website without the explicit prior written permission of Fusion Media and/or the data provider. All intellectual property rights are reserved by the providers and/or the exchange providing the data contained in this website.
Fusion Media may be compensated by the advertisers that appear on the website, based on your interaction with the advertisements or advertisers.
© 2007-2024 - Fusion Media Limited. All Rights Reserved.