USDCHF
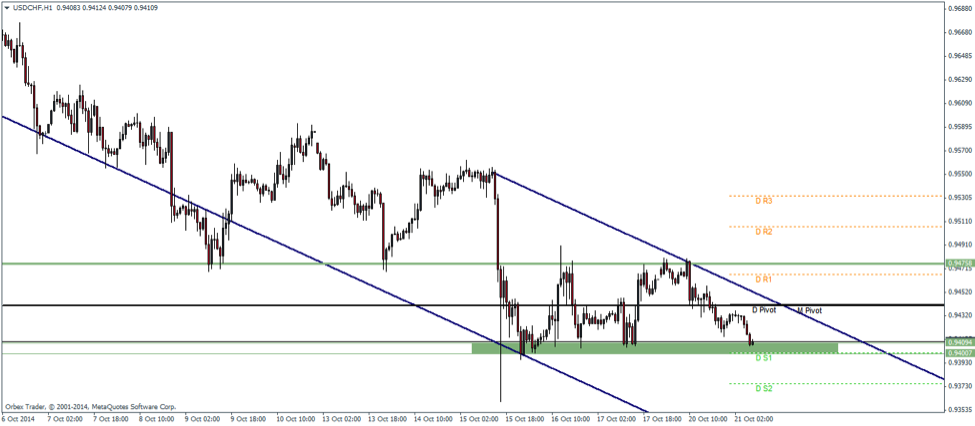
The USDCHF started its decline since late Friday as capital flow into the safe-haven Swiss Franc in the backdrop of risk aversion. At the time of writing, the USDCHF is trading near a short term support level between 0.941 – 0.94 region within a down sloping channel. A break of this support level could see USDCHF test new weekly lows targeting the daily support levels, after the previous rally stalled near a previously established support level which was broken to be tested for resistance at 0.9475.
USDCHF Pivot Levels
R3 - 0.9532
R2 - 0.9506
R1 - 0.9467
Pivot - 0.9441
S1 - 0.94
S2 - 0.9375
S3 - 0.93358
The confluence of the daily and monthly pivot levels near 0.944 indicates a strong resistance level that could be tested which seems to validate any bounce from the support levels before it can be breached.

USDCAD
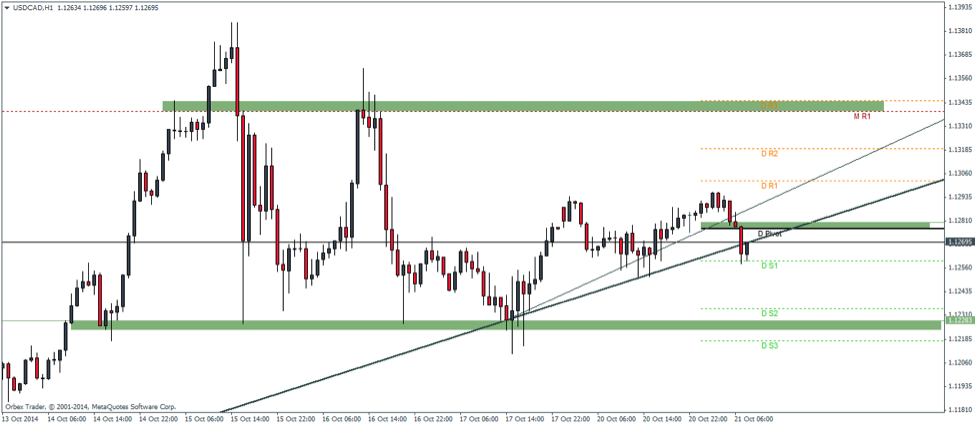
USDCAD has broken through its rising trend line and looks to be currently retracing the losses to test the break out level. It is quite possible for the Loonie to make a small rally towards the daily pivot level before continuing its declines. The major support comes in at 1.1228 levels. A minor trend line within the major trend line shows the original break out near 1.1281 which makes for the most likely price level for USDCAD to retrace back to before declining.
The key risks to the USDCAD comes later this week with the BoC overnight rate statement which is expected to remain unchanged, but market will be clued in for possible hints from the Bank of Canada. Ahead of the BoC release, we also get to see the monthly CPI numbers as well.
USDCAD Pivot Levels
R3 - 1.1344
R2 - 1.1319
R1 - 1.1302
Pivot - 1.1276
S1 - 1.1259
S2 - 1.1234
S3 - 1.1217
A break above the interim high at 1.13 could potentially invalidate this bias and a break and successful test of the support/resistance at 1.1281 could pave way for the next resistance near the monthly resistance level of 1.1339.

EURGBP
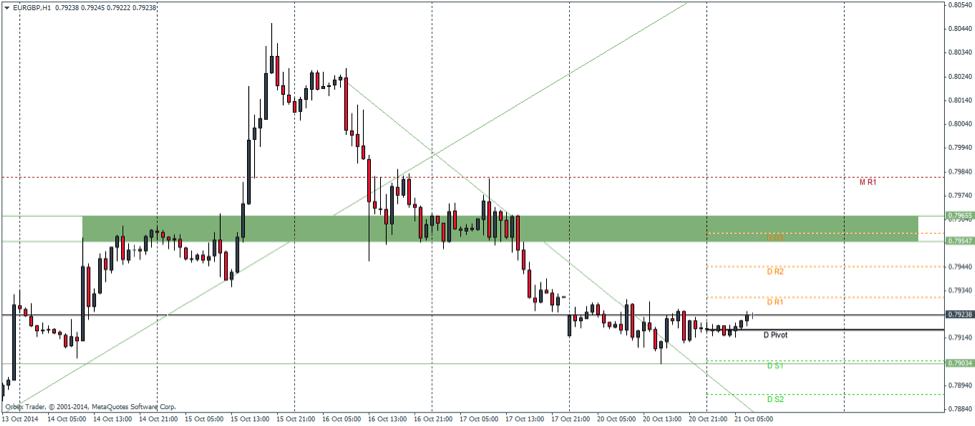
EURGBP gained last week on account of the Sterling’s weakness from the CPI data rallying back to the 0.8 handle. It was the unemployment data which managed to breathe some strength into the Sterling setting off a decline in the EURGBP. However, in the current context, this pair is looking to make yet another rally having broken the short term trend line. The reversal found with a piercing line candle right at the bottom of the short term downtrend adds more validity to the upside moves, which in most likelihood could see resistance near 0.795 – 0.796 levels.

Of course, in order for this objective to be achieved, EURGBP will first have to clear a short term resistance at 0.793 for any hopes of pushing higher.
EURGBP Pivot Levels
R3 - 0.7958
R2 - 0.7944
R1 - 0.7931
Pivot - 0.7917
S1 - 0.79
S2 - 0.789
S3 - 0.7877
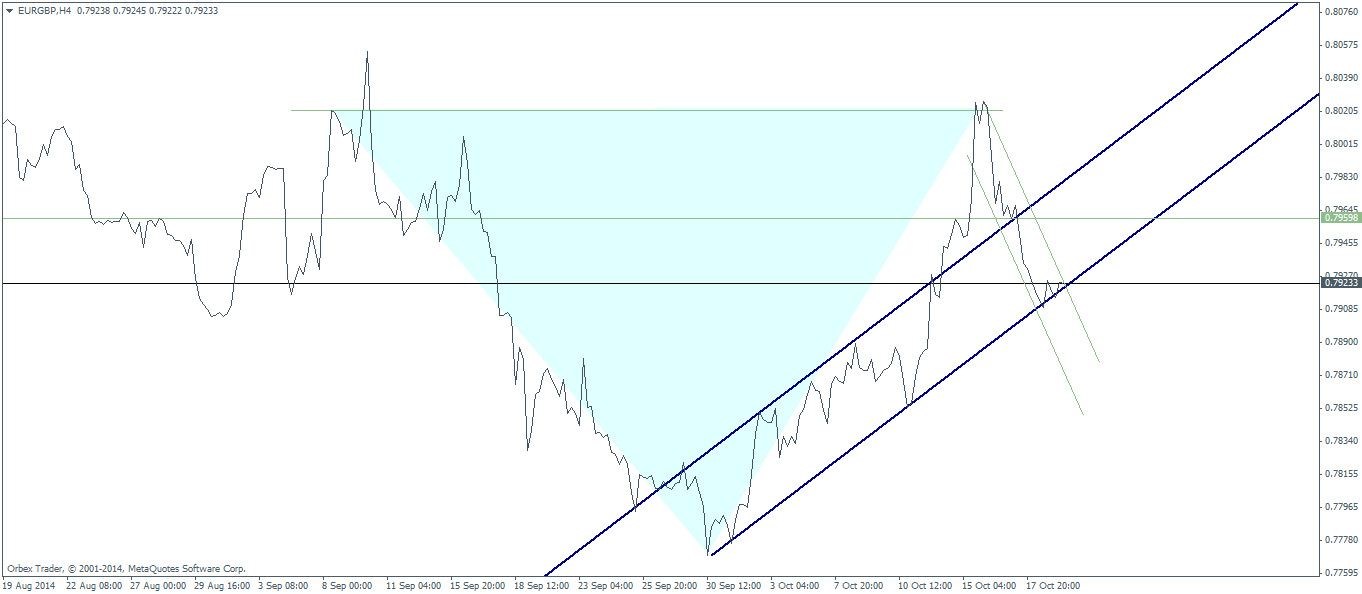
The rally towards 0.795 could most likely be the final test of resistance to the upside before EURGBP continues on its declining path. Having said that, on the H4 charts we notice a cup and handle formation, with the current decline stalling close to 38.2% Fib level of the previous rally. This makes it a bit tricky as it does outline a possibility of a rally higher, provided the resistance at 0.795/.796 gives way to test the next major resistance at 0.802.

- English (UK)
- English (India)
- English (Canada)
- English (Australia)
- English (South Africa)
- English (Philippines)
- English (Nigeria)
- Deutsch
- Español (España)
- Español (México)
- Français
- Italiano
- Nederlands
- Português (Portugal)
- Polski
- Português (Brasil)
- Русский
- Türkçe
- العربية
- Ελληνικά
- Svenska
- Suomi
- עברית
- 日本語
- 한국어
- 简体中文
- 繁體中文
- Bahasa Indonesia
- Bahasa Melayu
- ไทย
- Tiếng Việt
- हिंदी
USD/CHF, USD/CAD, EUR/GBP: Daily Technical Analysis
Published 10/21/2014, 05:56 AM
Updated 08/29/2019, 07:20 AM
USD/CHF, USD/CAD, EUR/GBP: Daily Technical Analysis

ORBEX
3rd party Ad. Not an offer or recommendation by Investing.com. See disclosure here or
remove ads
.
Latest comments
Install Our App
Risk Disclosure: Trading in financial instruments and/or cryptocurrencies involves high risks including the risk of losing some, or all, of your investment amount, and may not be suitable for all investors. Prices of cryptocurrencies are extremely volatile and may be affected by external factors such as financial, regulatory or political events. Trading on margin increases the financial risks.
Before deciding to trade in financial instrument or cryptocurrencies you should be fully informed of the risks and costs associated with trading the financial markets, carefully consider your investment objectives, level of experience, and risk appetite, and seek professional advice where needed.
Fusion Media would like to remind you that the data contained in this website is not necessarily real-time nor accurate. The data and prices on the website are not necessarily provided by any market or exchange, but may be provided by market makers, and so prices may not be accurate and may differ from the actual price at any given market, meaning prices are indicative and not appropriate for trading purposes. Fusion Media and any provider of the data contained in this website will not accept liability for any loss or damage as a result of your trading, or your reliance on the information contained within this website.
It is prohibited to use, store, reproduce, display, modify, transmit or distribute the data contained in this website without the explicit prior written permission of Fusion Media and/or the data provider. All intellectual property rights are reserved by the providers and/or the exchange providing the data contained in this website.
Fusion Media may be compensated by the advertisers that appear on the website, based on your interaction with the advertisements or advertisers.
© 2007-2024 - Fusion Media Limited. All Rights Reserved.