Get 40% Off
⚠ Earnings Alert! Which stocks are poised to surge?
See the stocks on our ProPicks radar. These strategies gained 19.7% year-to-date.
Unlock full list

USD/CAD: Potential For Swing Low To Form Above Support

Published 11/17/2014, 05:42 AM
Updated 07/09/2023, 06:31 AM

Asia Roundup

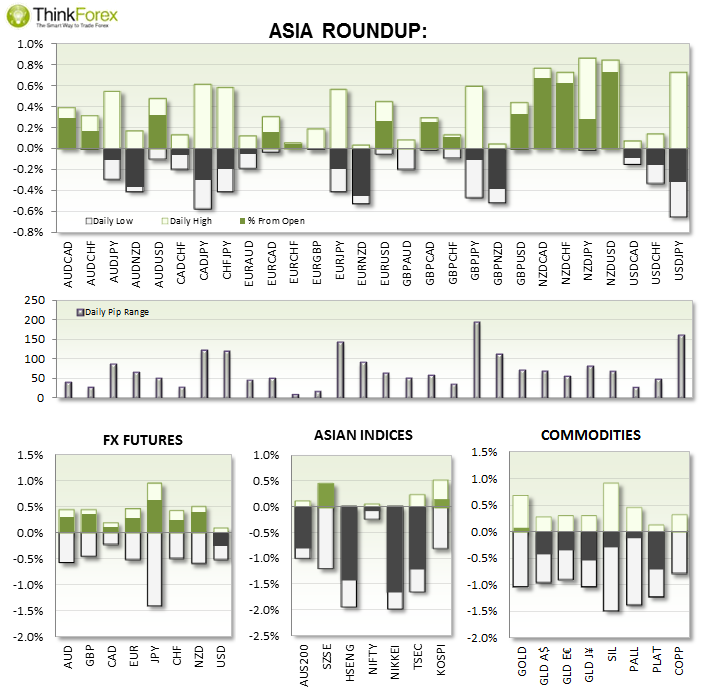
JPY: Japan is now in recession following a 2nd consecutive contracting GDP, which is -0.4% missing expectations of 0.5%. The previous quarter was -1.8%. The consensus is for a snap election and delay of the next sales tax rise. 
AUD: Vehicle sales down -1.6%

UP NEXT: 


Economic Calendar

Pairs to Monitor:

TECHNICAL ANALYSIS: 

USD/CAD: Potential for swing low to form above support
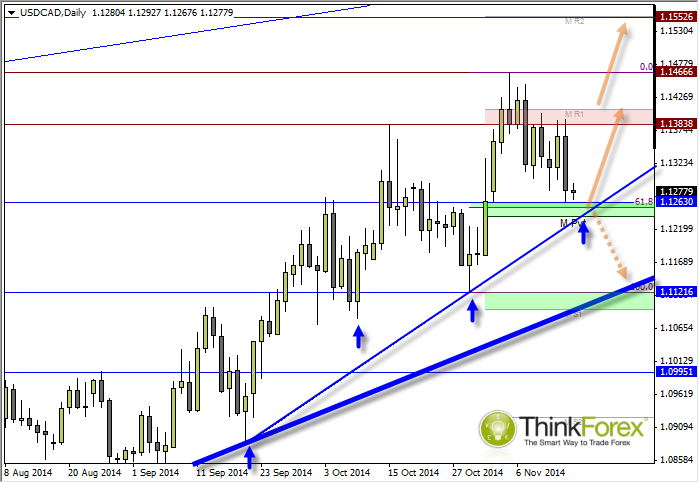
USD/CAD Daily Chart

There are several technical levels close by which may act as support and offer the potential for a relatively high reward/risk ratio to assume a long position.

The cycle troughs have been quite rhythmical, so if these remain consistent then we can expect a cycle low this week. 

If there is anything going against the trade right now, it's the Bearish Engulfing Candle from Friday and that price remains around the lows of this candle. However if you look back at previous swing lows you'll notice that each swing low has seen a grizzly bearish candle right before the turning point.

Those eager to get in could consider buying at market. These who prefer a little more confirmation can see if we generate a bullish candle today or tomorrow. 

USD/CHFSwissy ponders at a juncture

USD/CHF Daily Chart

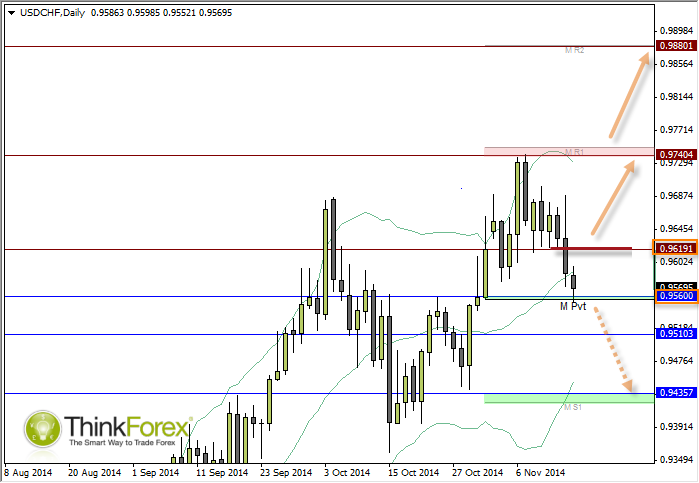
We have seen price revert to the mean as suggested on the 12th November and now await for either a basing pattern to form around current levels, or for a deeper retracement. 

One option would be to set a buy-stop above 0.9720 resistance to catch any upside break. Should price break below 0.9560 then the order can be cancelled.

Alternatively a break below 0.9560 support could be taken as a sign for price to visit the lower Bollinger Band. However keep in mind this is trading against the dominant, bullish trend. 

GBP/USDInverted Head and Shoulders in play

GBP/USD Hour Chart

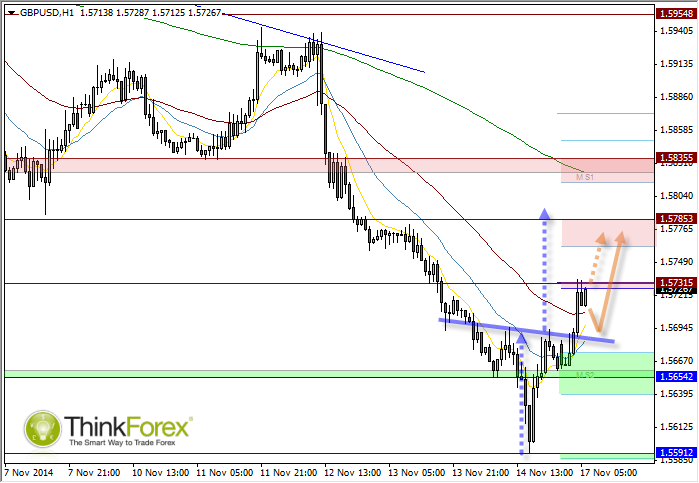
The 'Head' of the H&S rejected 1.56 with a V-Bottom to suggest aggressive buying at this level. The neckline has been confirmed and may act as support upon any retracements. A break below the neckline invalidates the setup. 

However we may not see a retracement as price is forming a Bull Flag below 1.573 resistance. A break above this level should open up 1.578.

Latest comments

Risk Disclosure: Trading in financial instruments and/or cryptocurrencies involves high risks including the risk of losing some, or all, of your investment amount, and may not be suitable for all investors. Prices of cryptocurrencies are extremely volatile and may be affected by external factors such as financial, regulatory or political events. Trading on margin increases the financial risks.
Before deciding to trade in financial instrument or cryptocurrencies you should be fully informed of the risks and costs associated with trading the financial markets, carefully consider your investment objectives, level of experience, and risk appetite, and seek professional advice where needed.
Fusion Media would like to remind you that the data contained in this website is not necessarily real-time nor accurate. The data and prices on the website are not necessarily provided by any market or exchange, but may be provided by market makers, and so prices may not be accurate and may differ from the actual price at any given market, meaning prices are indicative and not appropriate for trading purposes. Fusion Media and any provider of the data contained in this website will not accept liability for any loss or damage as a result of your trading, or your reliance on the information contained within this website.
It is prohibited to use, store, reproduce, display, modify, transmit or distribute the data contained in this website without the explicit prior written permission of Fusion Media and/or the data provider. All intellectual property rights are reserved by the providers and/or the exchange providing the data contained in this website.
Fusion Media may be compensated by the advertisers that appear on the website, based on your interaction with the advertisements or advertisers.
© 2007-2024 - Fusion Media Limited. All Rights Reserved.