
During the end of the previous week, the USD/CAD created a strong buy signal which was the result of a bullish breakout from the long-term triangle formation. At the beginning of the new week, traders followed that signal and beat the highs from the month of August. This looks like a good place for taking profits and this is likely to happen due to the candle with the long upper wick indicating weakening on high levels.
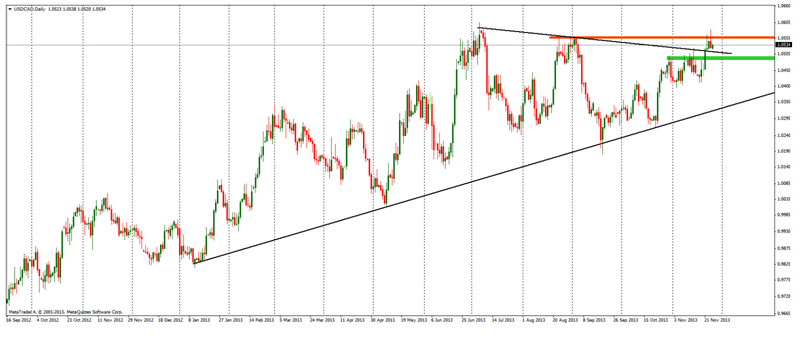 USD/CAD Daily Chart" title="USD/CAD Daily Chart" height="340" width="805">
Despite the shooting star candle, the sentiment stays bullish and will stay positive as long as the price stays above the upper line of the triangle and the horizontal support on the 1.05 (green area). Breaking this level will deny the buy signal, but chances for that are currently limited.
Fundamentally, we do not have any major data for the CAD this week, so we can assume that this pair will be driven mainly by data from the US and the technical analysis.