Market Commentary
US dollar index closes at highest in levels in 3 months; USD seen as best bet as global macro outlook weakens; commodities collapse, gold down $50 in Asian trade overnight. US CPI as expected; benchmark rates end lower on the week; odds for September rate hike steady at 1 in 3.
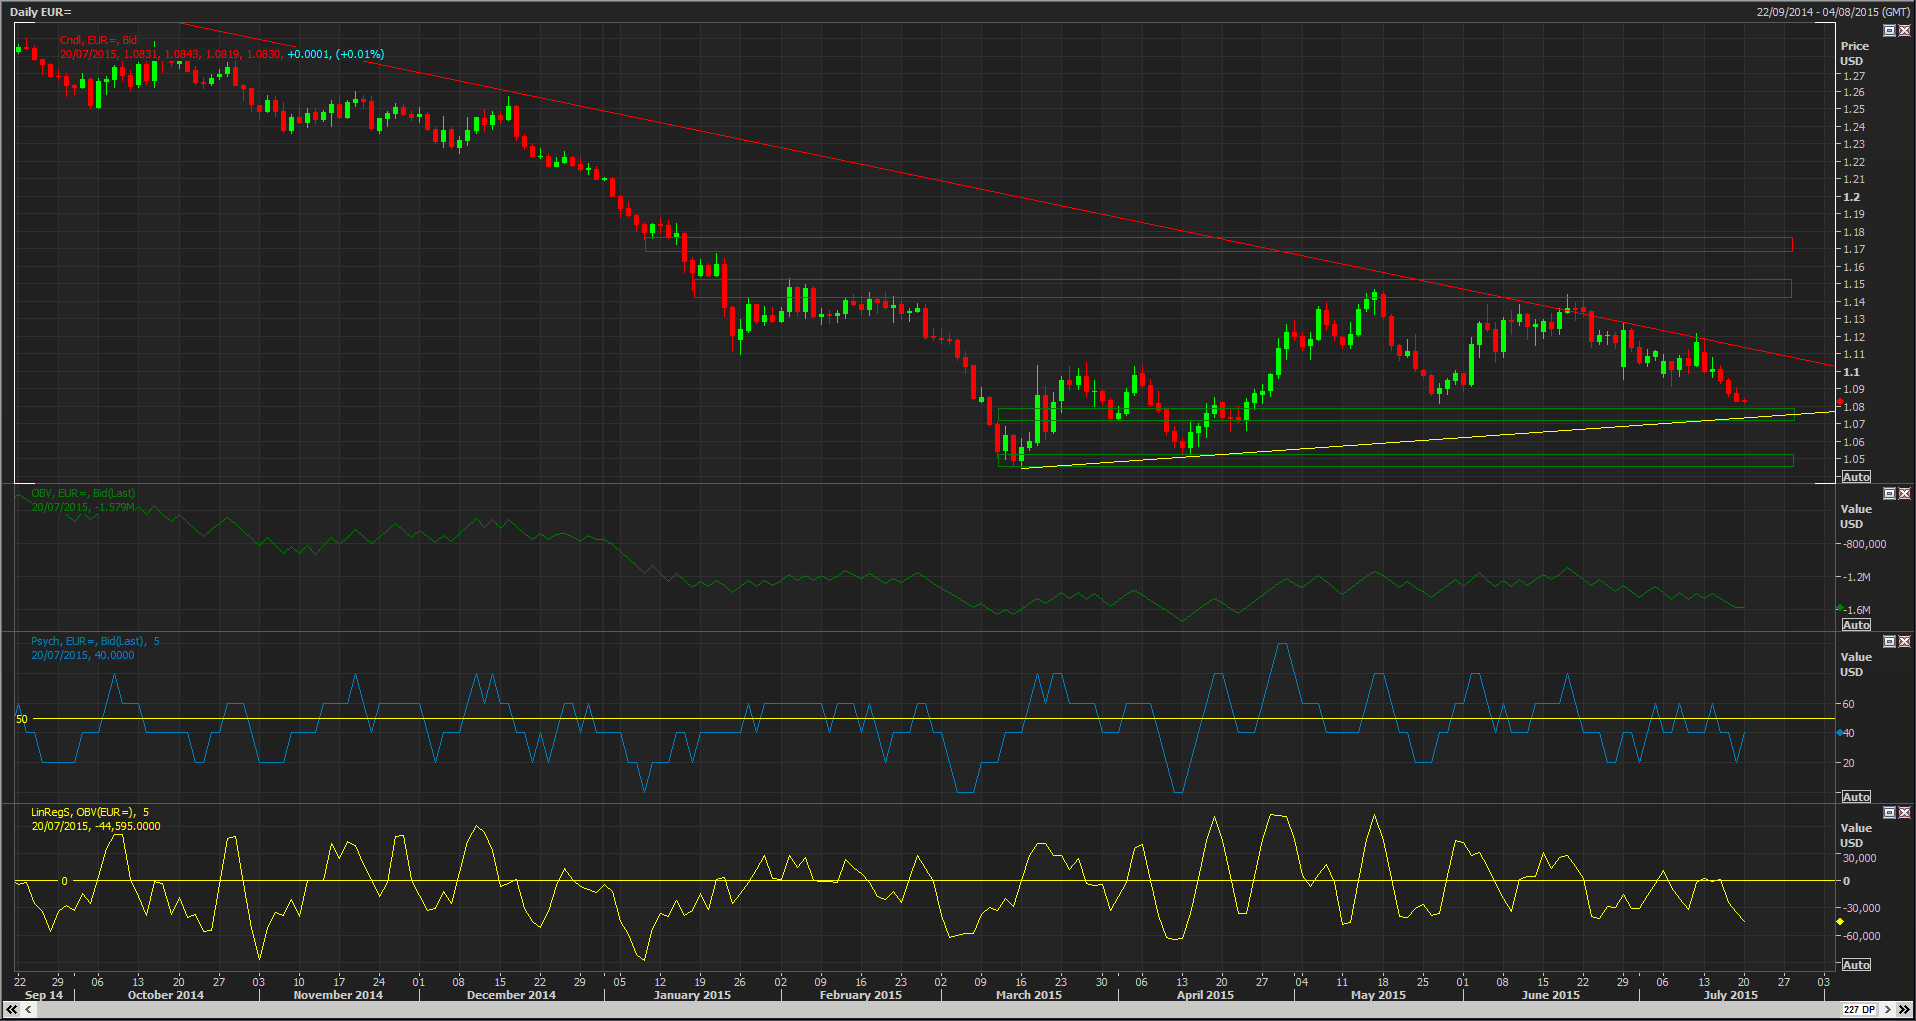
EUR/USD dropped more than 2 percent last week and tested the low at 1.0826 on Friday, a level last seen on May 27. Traders shifted attention from the Greek crisis to the economic fundamentals between euro zone and the US. The diverging policy outlook between the euro zone and the US should see the euro continue to weaken while the US economy is picking up.
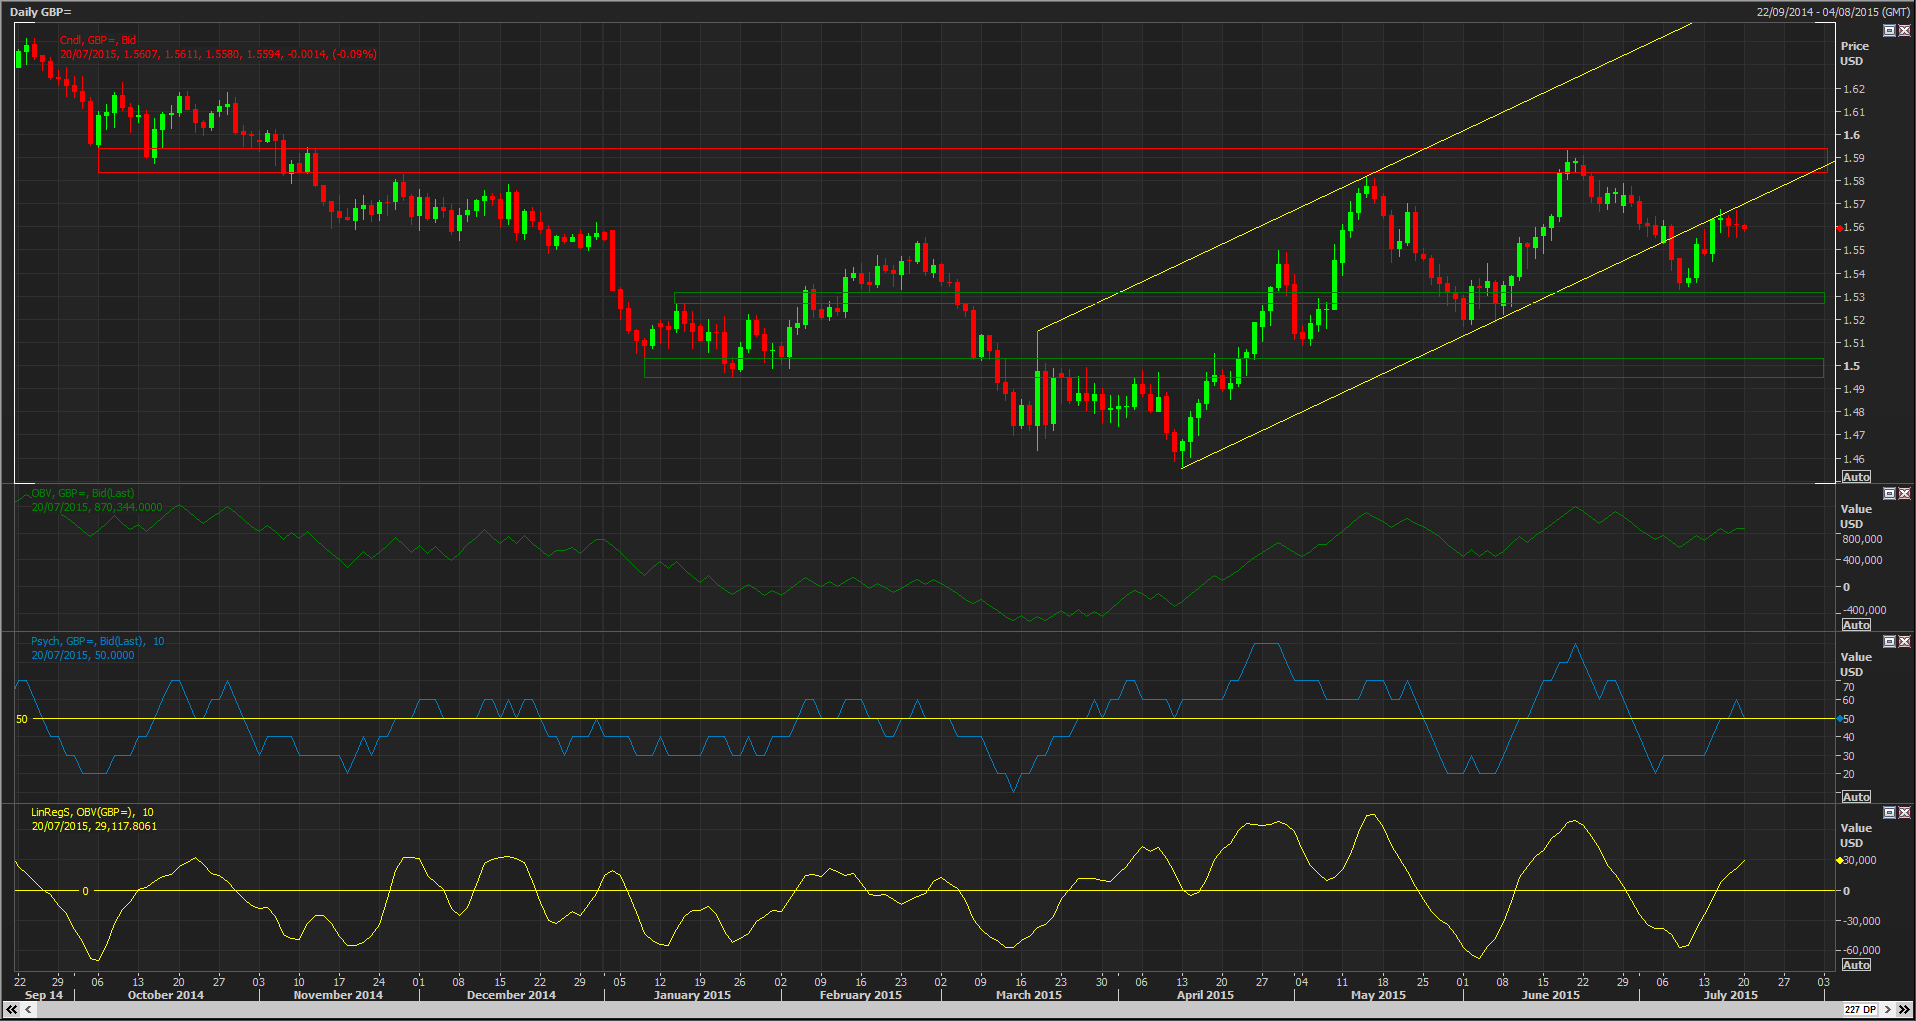
GBP/USD remained stable after Bank of England Governor Mark Carney gave his strongest hint yet on the timing of a UK rate rise, saying a decision would come into focus around the end of 2015. The need for rate hike reflects the momentum in the economy and a gradual firming of underlying inflationary pressures, Carney said.
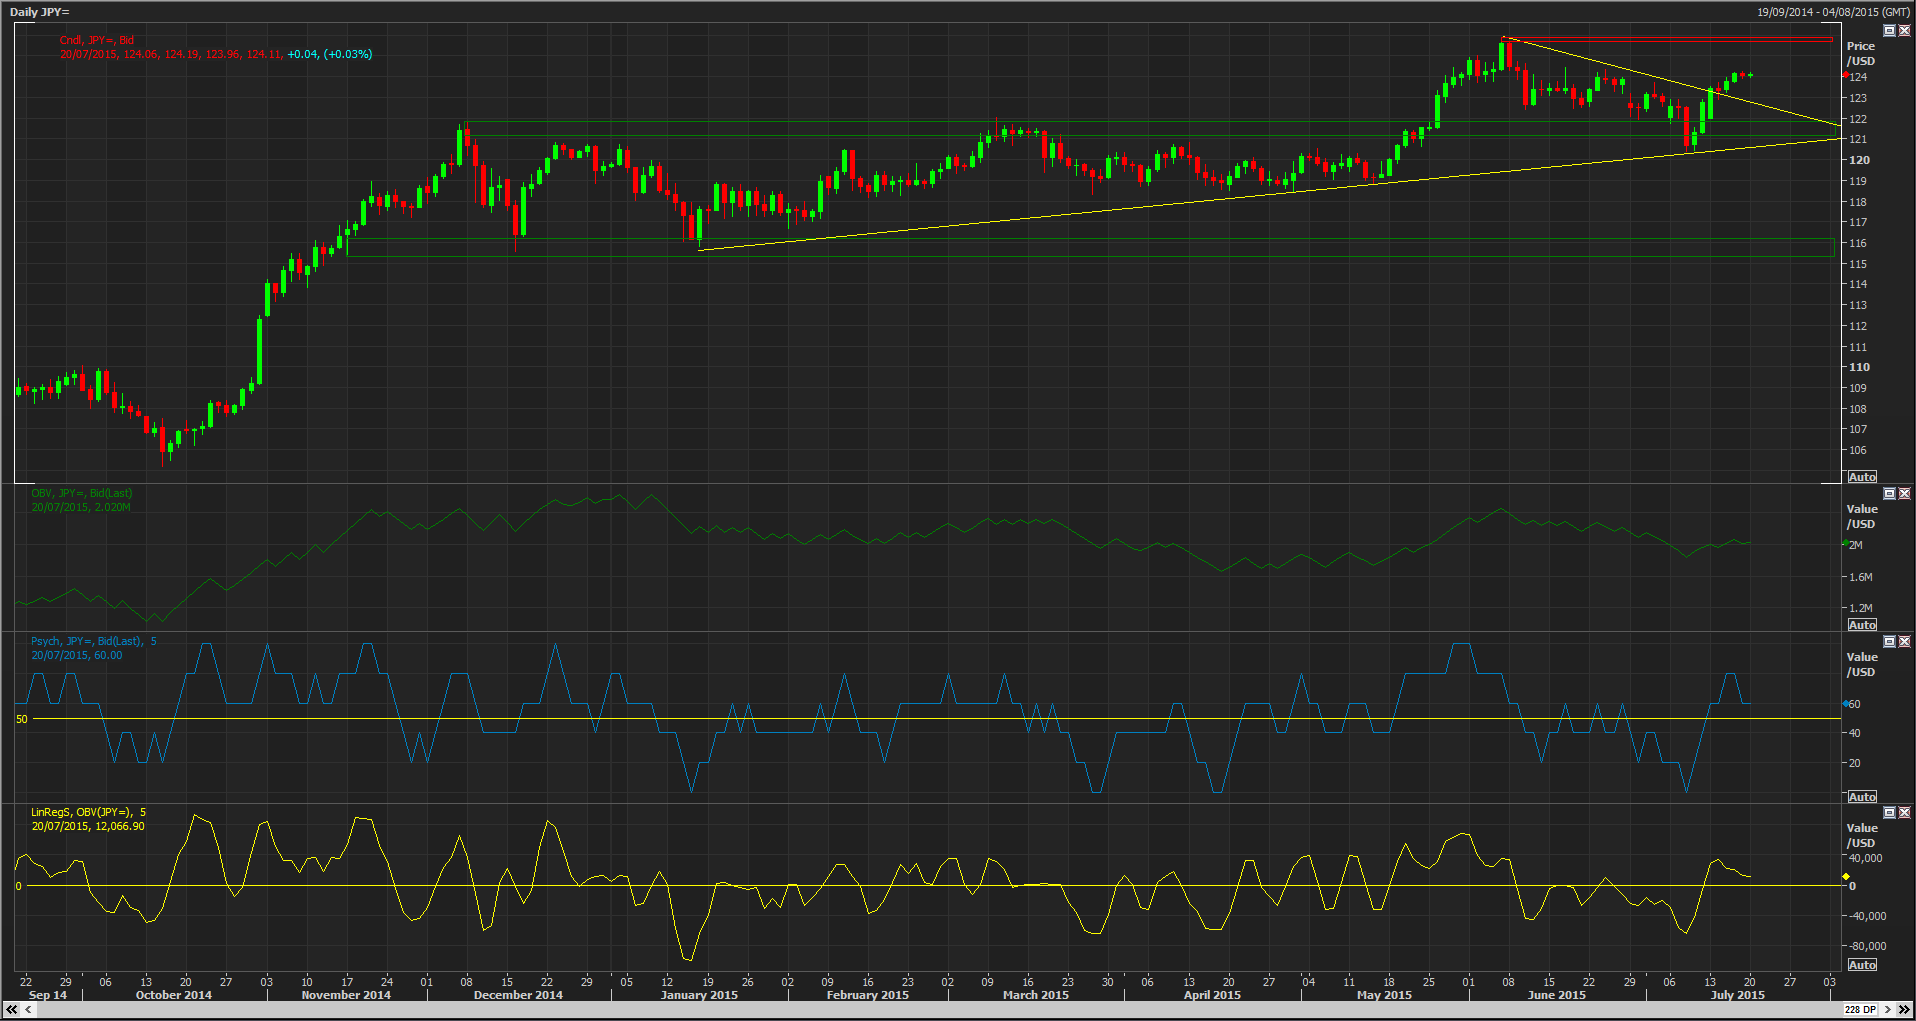
The USD/JPY tested a one-month peak of 124.23 closing above the 124 handle last week. Congressional testimony by US Federal Reserve Chief Yellen said that a rise in interest rates may happen by year-end strengthened the dollar against the yen, considered a positive in export-oriented Japan.
Technical Commentary
EUR/USD Short Term (1-3 Days): Bearish – Medium Term (1-3 Weeks) Bearish
- While 1.0950 caps intraday upside expect a test of 1.0780/1.08, failure here opens 2015 lows downside pressure only reduced on a break above 1.1050
- Daily Order Flow bearish; OBV sideways, Linear Regression and Psychology rotate around midpoints with bearish bias
- Monitoring intraday price and Order Flow indicators on a test of 1.13 or 1.08

GBP/USD: Short Term (1-3 Days): Bullish – Medium Term (1-3 Weeks) Bearish
- While 1.57 caps upside a break back below 1.5550 suggests bearish symmetry target at 1.5285 remains in play a close above 1.57 negates near term bearishness and resets focus on the 1.60 upside psych objective.
- Daily Order Flow bullish; OBV sideways to up, Linear Regression and Psychology pierce midpoints from below
- Monitoring intraday price action and Order Flow indicators on a test of 1.5285 or 1.5750

USD/JPY: Short Term (1-3 Days): Bullish – Medium Term (1-3 Weeks) Bullish
- Close above 124 now targets 125.85 next and 128 in extension, expect intraday downside reactions to be supported at 123.50 a failure at 122.50 again opens 120 in retest of ascending triangle trend line.
- Daily Order Flow bullish; OBV sideways, Linear Regression and Psychology bullish but lack momentum, retesting midpoints from above.
- Monitoring intraday price action and Order Flow indicators on a test of 128 or 120

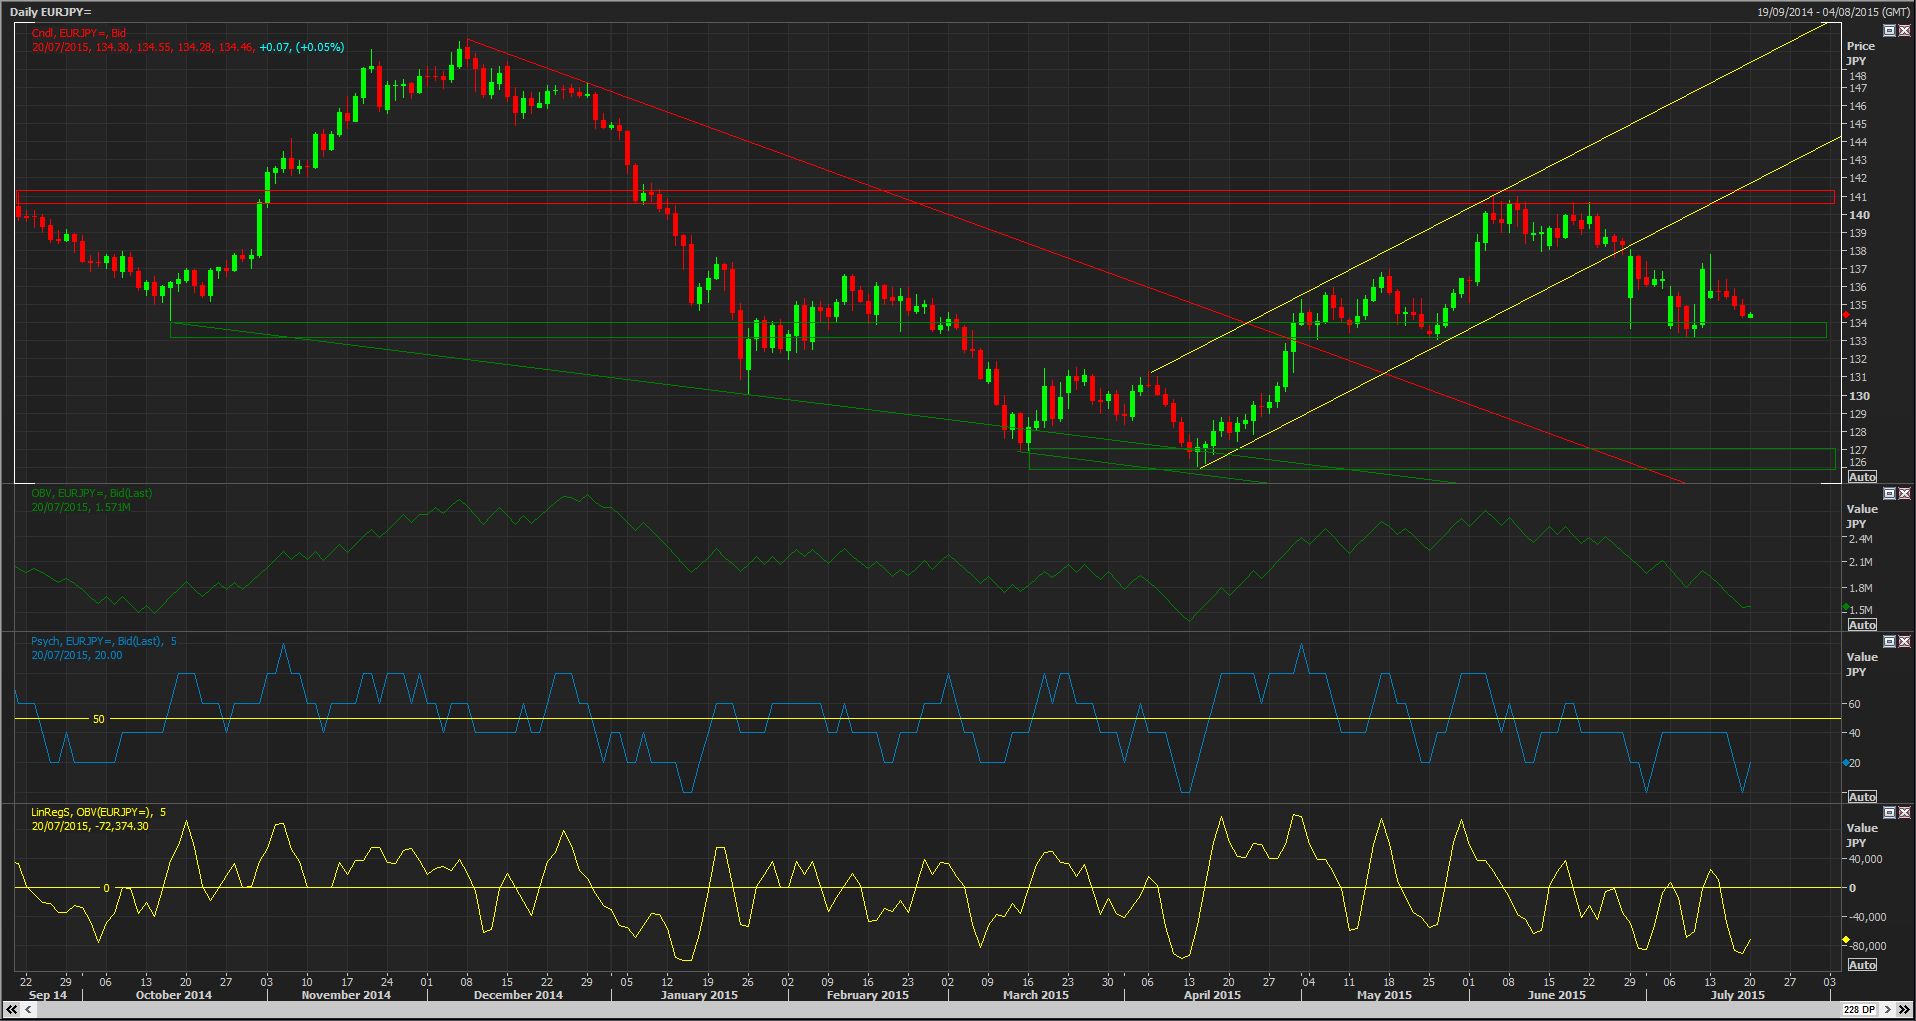
EUR/JPY: Short Term (1-3 Days): Bearish – Medium Term (1-3 Weeks) Bearish
- Range trade persists, 133/34 range support a breach of 133 opens retest of 2015 lows while above 138 range resistance, opens 143
- Daily Order Flow bearish; OBV sideways, Linear Regression and Psychology bearish
- Monitoring intraday price action and Order Flow indicators at 138 and 133

