US Stocks traded lower yesterday, on a day with weaker than expected economic numbers released. US Durable Goods orders was weaker with a headline print of -7.3% vs an expected -4.0%. Looking beneath the headline figure, it seems that major sectors were all lower than expected. Durables excluding Transportation shrank 0.6% vs an expected 0.5% growth. Non- Def Capital Goods order declined the most, falling by 3.3% vs an expectation of 0.5% gain. Cap Goods Shipped has also fallen by 1.5% vs a 0.3% growth expected.
However, US stocks did not actually trade lower despite the bearish numbers being released before market open. Stock prices did suffer a slight dip during the 1st hour of trade, but recovered most of the losses and then some for the rest of the day. There was some slightly bullish number from Dallas Fed’s Manufacturing Activity Index which was released post market open, which came in 5.0 vs an expected 4.0. But this number is generally not a huge market mover, and the latest print wasn’t that bullish if we consider that the readings tend to be extremely volatile, and a 1.0 overshot can be regarded as “on target”. Hence it is highly unlikely that this is the main reason stock prices were able to ignore the more important Durable Goods Orders.
Perhaps the rally can be explained by looking at US10Y price action yesterday. The 10Y price traded higher during early US session, only to dip slightly towards the close. The initial rally of treasuries coincided with the release of Durable Goods numbers, which is reasonable as worsening economic numbers increase risk aversion, and hence drive safe assets such as treasuries higher. However, Stock prices actually rallied around the same time, suggesting that stock traders believed that a weaker US economy would result in lesser risks of a QE cut. This would also explain the dip in both Treasuries and Stock prices towards the end of yesterday session – fresh bout of QE taper fears entering again, sending stocks prices sharply lower.
S&P 500 Hourly Chart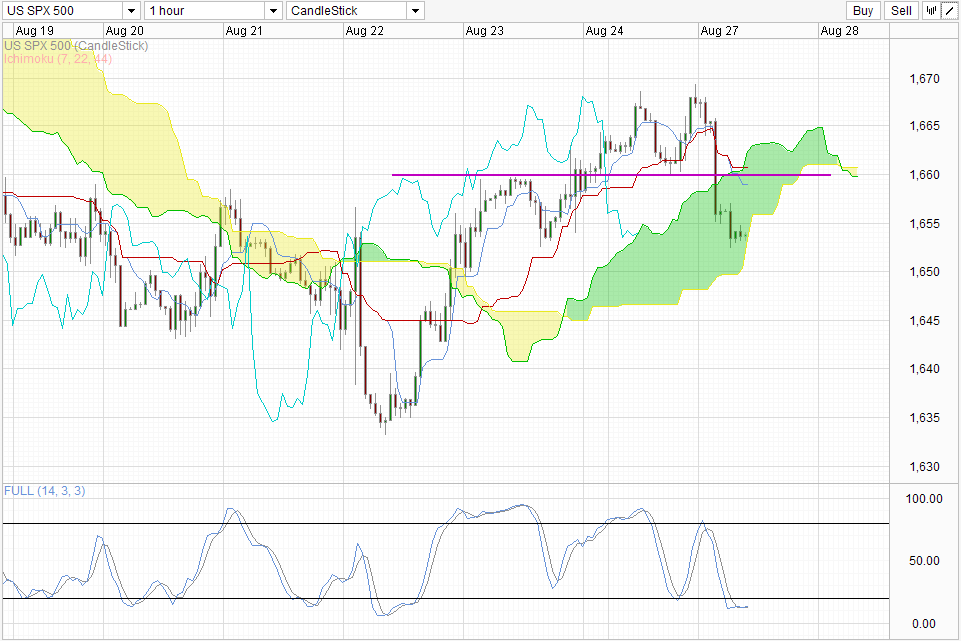
From a technical perspective, the renewed taper fears have allowed S&P 500 to break the 1,660 support which was the confluence with Ichimoku’s Senkou Span A. Currently we are trading around the minor dip of 23rd Aug and staying close to the edge of the Senkou Span B. If we trade lower from here, a Kumo breakout will occur and confirms the bearish Kumo Twist ahead, potentially sending price towards 1,645 which is the 1st floor of current consolidation zone.
Dow 30 Hourly Chart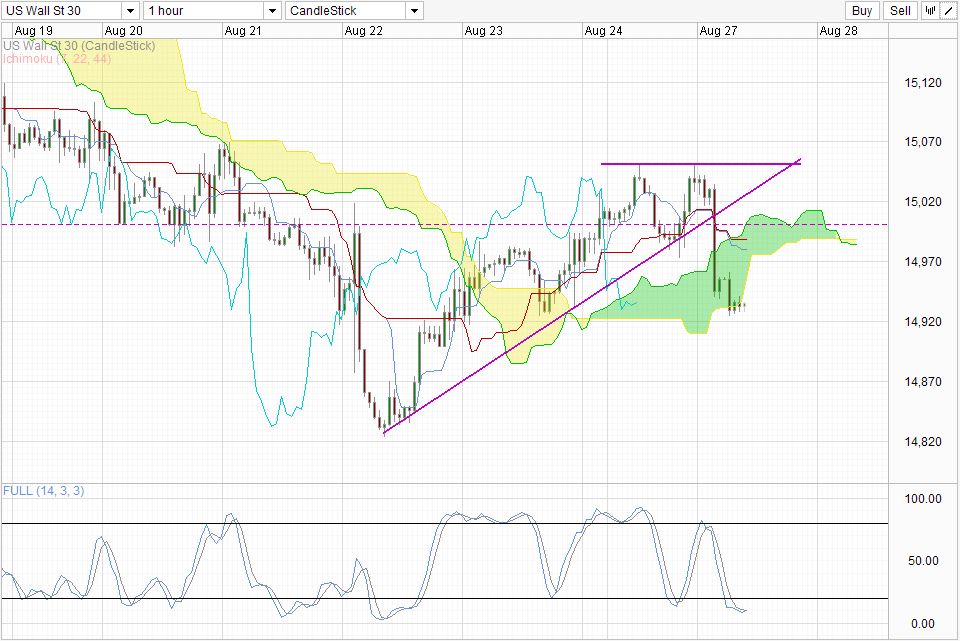
Dow 30 remains slightly more bearish. Price has already broken out of the Kumo, and barely supported by the 14,925 soft support found on 23rd Aug. A breach of the level will open up swing low around 14,850 as the bearish target. Stochastic readings on Dow 30 is also pointing lower, unlike the ones seen on S&P 500. Hence, if a Kumo breakout is seen on S&P 500, the chances of Dow 30 hitting 14,850 increases. Similarly, if Dow 30 manage to hold current support and perhaps trade within the Overhead Kumo again, the chances of S&P 500 pushing up towards 1,660 increases.
Original post
- English (UK)
- English (India)
- English (Canada)
- English (Australia)
- English (South Africa)
- English (Philippines)
- English (Nigeria)
- Deutsch
- Español (España)
- Español (México)
- Français
- Italiano
- Nederlands
- Português (Portugal)
- Polski
- Português (Brasil)
- Русский
- Türkçe
- العربية
- Ελληνικά
- Svenska
- Suomi
- עברית
- 日本語
- 한국어
- 简体中文
- 繁體中文
- Bahasa Indonesia
- Bahasa Melayu
- ไทย
- Tiếng Việt
- हिंदी
US Market Roundup: Fear Of Taper Trumping Fundamentals
Published 08/27/2013, 01:08 AM
Updated 07/09/2023, 06:31 AM
US Market Roundup: Fear Of Taper Trumping Fundamentals
Latest comments
Install Our App
Risk Disclosure: Trading in financial instruments and/or cryptocurrencies involves high risks including the risk of losing some, or all, of your investment amount, and may not be suitable for all investors. Prices of cryptocurrencies are extremely volatile and may be affected by external factors such as financial, regulatory or political events. Trading on margin increases the financial risks.
Before deciding to trade in financial instrument or cryptocurrencies you should be fully informed of the risks and costs associated with trading the financial markets, carefully consider your investment objectives, level of experience, and risk appetite, and seek professional advice where needed.
Fusion Media would like to remind you that the data contained in this website is not necessarily real-time nor accurate. The data and prices on the website are not necessarily provided by any market or exchange, but may be provided by market makers, and so prices may not be accurate and may differ from the actual price at any given market, meaning prices are indicative and not appropriate for trading purposes. Fusion Media and any provider of the data contained in this website will not accept liability for any loss or damage as a result of your trading, or your reliance on the information contained within this website.
It is prohibited to use, store, reproduce, display, modify, transmit or distribute the data contained in this website without the explicit prior written permission of Fusion Media and/or the data provider. All intellectual property rights are reserved by the providers and/or the exchange providing the data contained in this website.
Fusion Media may be compensated by the advertisers that appear on the website, based on your interaction with the advertisements or advertisers.
© 2007-2024 - Fusion Media Limited. All Rights Reserved.