
US economic growth slowed in this year’s first quarter, perhaps to the point that the quarterly change for Q1 GDP will be flat in the Commerce Department’s “advance” estimate that’s scheduled for release on Apr. 29. From a business cycle perspective, however, the recent deceleration is modest so far. Indeed, there’s still a high degree of forward momentum in the macro trend based on the numbers in hand. Yes, the tide has turned, but moderately so and after a period of relatively strong growth.
The outlook may be shaky, but the broad macro trend remains solidly positive for a diversified set of indicators to date. The stumble of late in the economic data has pared the positive momentum, but the downgrade so far is incremental. The mystery is whether the deceleration in growth rolls on in the months to come. Meantime, business cycle risk remains low overall when measured across a broad set of indicators on a trend basis.
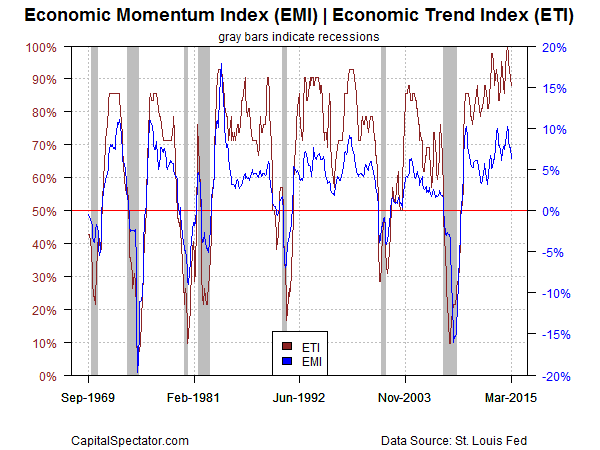
Using a methodology outlined in Nowcasting The Business Cycle: A Practical Guide For Spotting Business Cycle Peaks, an aggregate of economic and financial trend behavior suggests that recession risk for the US remained low in March. The Economic Trend and Momentum indices (ETI and EMI, respectively) continue to print at levels that equate with expansion. The current profile of published indicators through last month (12 of 14 data sets) for ETI and EMI reflect solidly positive trends with the exception of one data set (corporate bond spread).
Here’s a summary of recent activity for the components in ETI and EMI:

Aggregating the data into business cycle indexes continues to reflect positive trends. The latest numbers for ETI and EMI indicate that both benchmarks are well above their respective danger zones: 50% for ETI and 0% for EMI. When the indexes fall below those tipping points, we’ll have clear warning signs that recession risk is elevated. Based on the latest updates for March — ETI is 88.1% and EMI is 6.4% — there’s still a sizable margin of safety between current values and the danger zones, as shown in the chart. (See note below for ETI/EMI design rules.)
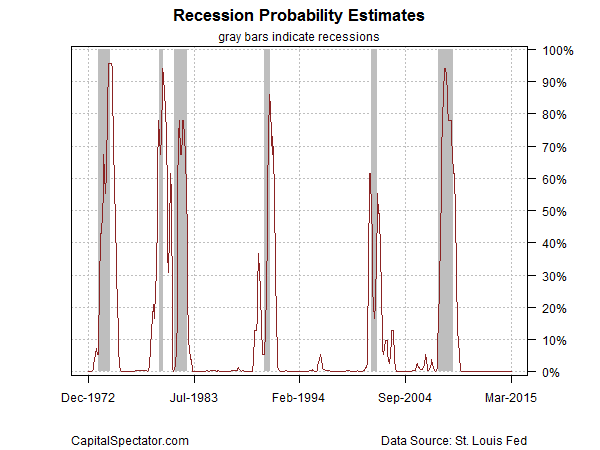
Translating ETI’s historical values into recession-risk probabilities via a probit model also suggests that business cycle risk remains low for the US. Analyzing the data with this methodology implies that the odds are virtually nil that the National Bureau of Economic Research (NBER) — the official arbiter of US business cycle dates — will declare last month as the start of a new recession.
Let’s also consider how ETI’s values may evolve as new data is published. One way to estimate future values for this index is with an econometric technique known as an autoregressive integrated moving average (ARIMA) model, based on calculations via the “forecast” package for R, a statistical software environment. The ARIMA model calculates the missing data points for each indicator, for each month through May 2015. (Note that January 2015 is currently the latest month with a complete set of published data.) Based on today’s projections, ETI is expected to remain well above its danger zone in the near term.

Forecasts are always suspect, of course, but recent projections of ETI for the near-term future have proven to be relatively reliable guesstimates vs. the full set of published numbers that followed. That’s not surprising, given the broadly diversified nature of ETI. Predicting individual components, by contrast, is prone to far more uncertainty in the short run. As such, the latest projections (the four black dots on the right in the chart above) offer support for optimism. The chart above also includes the range of vintage ETI projections published on these pages in previous months (blue bars), which you can compare with the complete monthly sets of actual data that followed, based on current numbers (red dots). The assumption here is that while any one forecast for a given indicator is likely to be wrong, the errors may cancel out to some degree by aggregating a broad set of predictions. That’s a reasonable assumption via the historical record for the ETI forecasts. For additional perspective on judging the track record of the forecasts, here are the previous updates for the last three months: