Near term U.S. 10-Year note yield outlook:
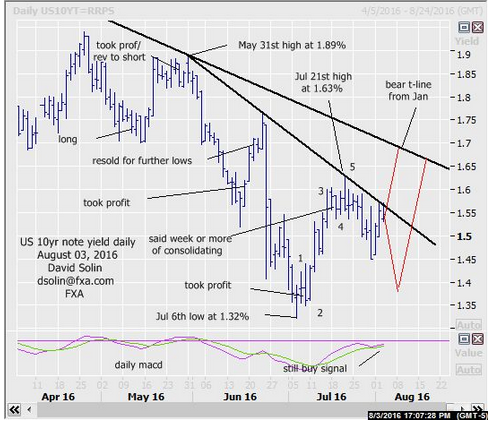
In the Aug 3rd email, affirmed the view of another week or more of consolidating from the Jul 21st high at 1.63% but seen as a correction, and with a resumption of the gains after. Note that the upmove from the Jul 6th low at 1.32% occurred in 5 waves (argues that the upside is not "complete") and along with still positive technicals (see buy mode on the daily macd) argues those new highs. However as been discussing, there is scope for a more extended/deeper pullback (as part of a larger bottoming) before resuming that upmove and with tomorrow's US payroll report for July, remains a risk (see in red on daily chart below). Nearby support is seen at 1.43/45% (last week's low, 62% retracement from the Jul 6th low at 1.32%), resistance remains at that bearish trendline from May 31st (currently at 1.56/58%, break/close above would argue that the downside correction from the Jul 21st high at 1.63% is "complete"). Bottom line: trade from the Jul 21st high at 1.63% is seen as a correction with eventual new highs, but some risk for a further near term period of correcting/basing first.
Strategy/position:
With the downside since Jul 21st seen as a correction, looking to trade from the long side. So for now (and with potential of volatility from tomorrow's US payroll report). Would buy on an intraday break .02 above that bearish trendline from May 31st, and then initially stopping on a close .02 back below. Would also buy at 1.36% (assuming a downside reaction and if that occurs first) and in that case, initially stopping on a close below 1.29% (just below that 1.32% low). A final note, there is some risk that gains above that Jul 21st high at 1.63% may be more limited and part of a more extended period of broad ranging (see longer term below), so in both cases will want to quickly get more aggressive with trailing stops on a move above the 1.63% high to reflect that risk.
Long term outlook:
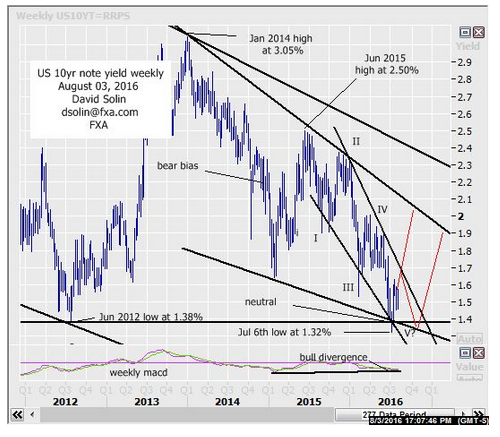
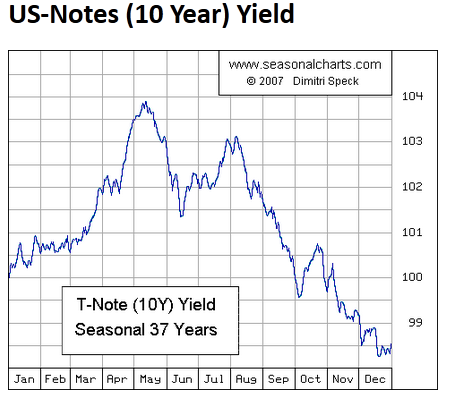
A more significant bottom/bottoming is also is seen process (for 6-9 months or more) after finally achieving that very long held, very long term target (years) below the Jun 2012 low at 1.38% (reached 1.32% on July 6th). Have also likely completed the 5 wave decline from the Jun 2015 high at 2.50% (wave V), long term technicals did not confirm that July low (see bullish divergence on the weekly macd) and bullish "false break" of that June 2012 low at 1.38% all add to this longer term bottoming view. Also, an important driver to my continued very long term bearish bias over the last few years had been the relentless bullishness and attempts to buy yield (sell notes) over and over (and continually getting stopped) by most analysts/traders (contrary indicator). This has finally switched (at least somewhat) as most now expected more stable "lower for longer" in regards to the US 10yr yield. A final note, there remains some risk for a more extended period of ranging/bottoming (see in red on weekly chart/2nd chart below) and with the seasonal chart that peaks around this time (and declines into the end of the year, see 3rd chart below) adding to that possibility. Key, big picture resistance is seen at the bearish trendline from Jan (currently at 1.70/75%) as a break/close clearly above would argue that the larger bottoming is "complete". Bottom line : a more major bottoming is favored (low for 6-9 months) but with some scope for a more extended period of ranging/basing.
Strategy/position:
With near term gains above 1.63% favored (see shorter term above) and potential for the upside to become more significant, would use the same entry/exit as the shorter term above to switch the longer term bias to bullish. However will be looking to reassess the bigger picture on gains above that 1.63%. This way if more substantial upside becomes more likely, won't have to "chase" the market higher at that point.
Current:
Nearer term : viewed as a bottoming, see strategy for entry ahead.
Last : resold Jun 22 at 1.69%, took profit Jun 23 above top of wedge (1.38% for .31 profit).
Longer term: gains above 1.63% may be more significant, use same entry/exit as shorter term.
Last : bearish bias Dec 17th at 2.09% to neutral Jun 23rd at 1.38%.


