Get 40% Off
⚠ Earnings Alert! Which stocks are poised to surge?
See the stocks on our ProPicks radar. These strategies gained 19.7% year-to-date.
Unlock full list

10 Charts Prove The Uptrend Is NOT Dead

Published 04/01/2016, 04:30 PM
Updated 07/09/2023, 06:31 AM

Month-Ending Monthly-Charts


As we start the spring season, passing the end of March yesterday, I want to share all of the indices monthly-charts to understand the big picture perspective (see this article). I've been emphatically expressing that it's imperative that we understand the big picture to understand the current sentiment.

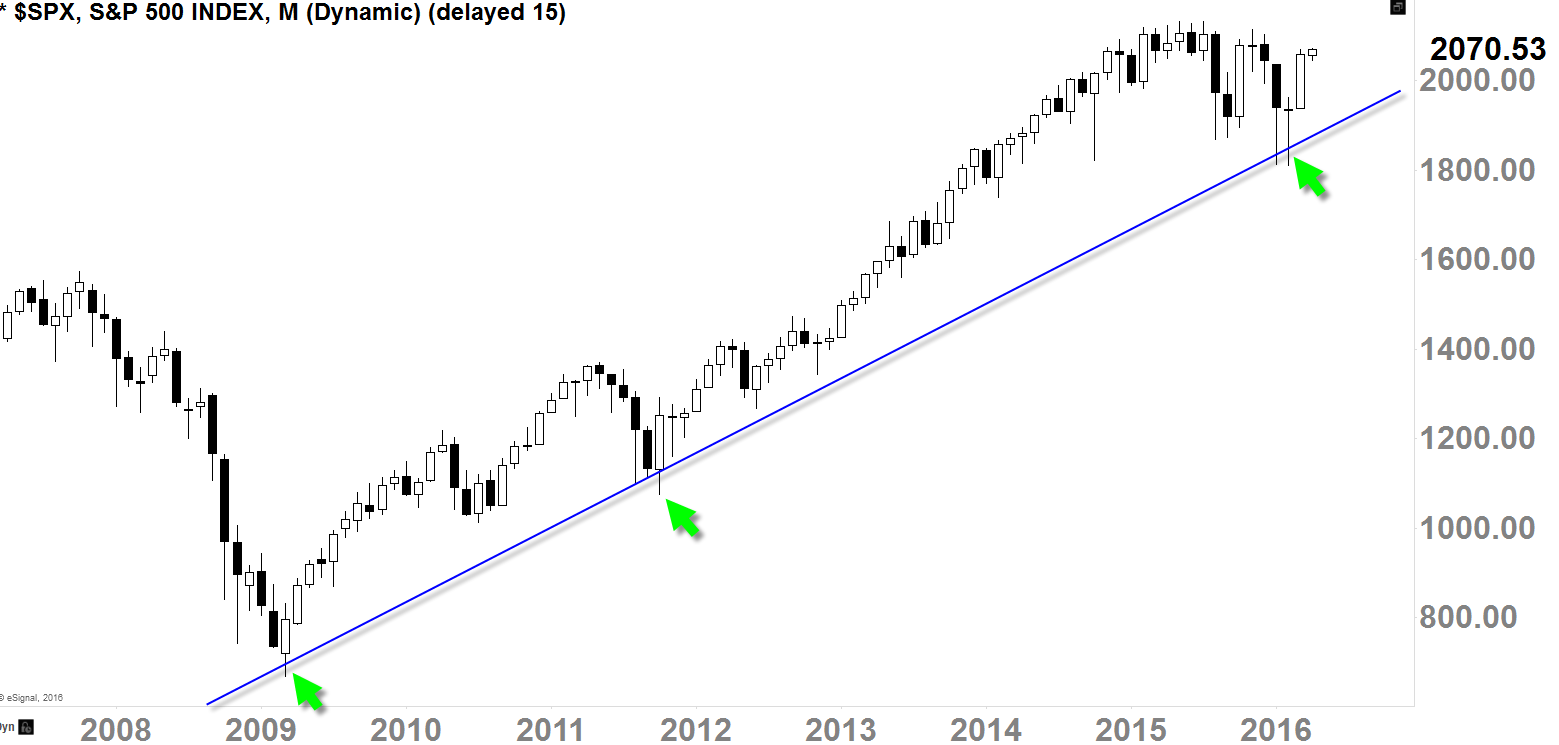
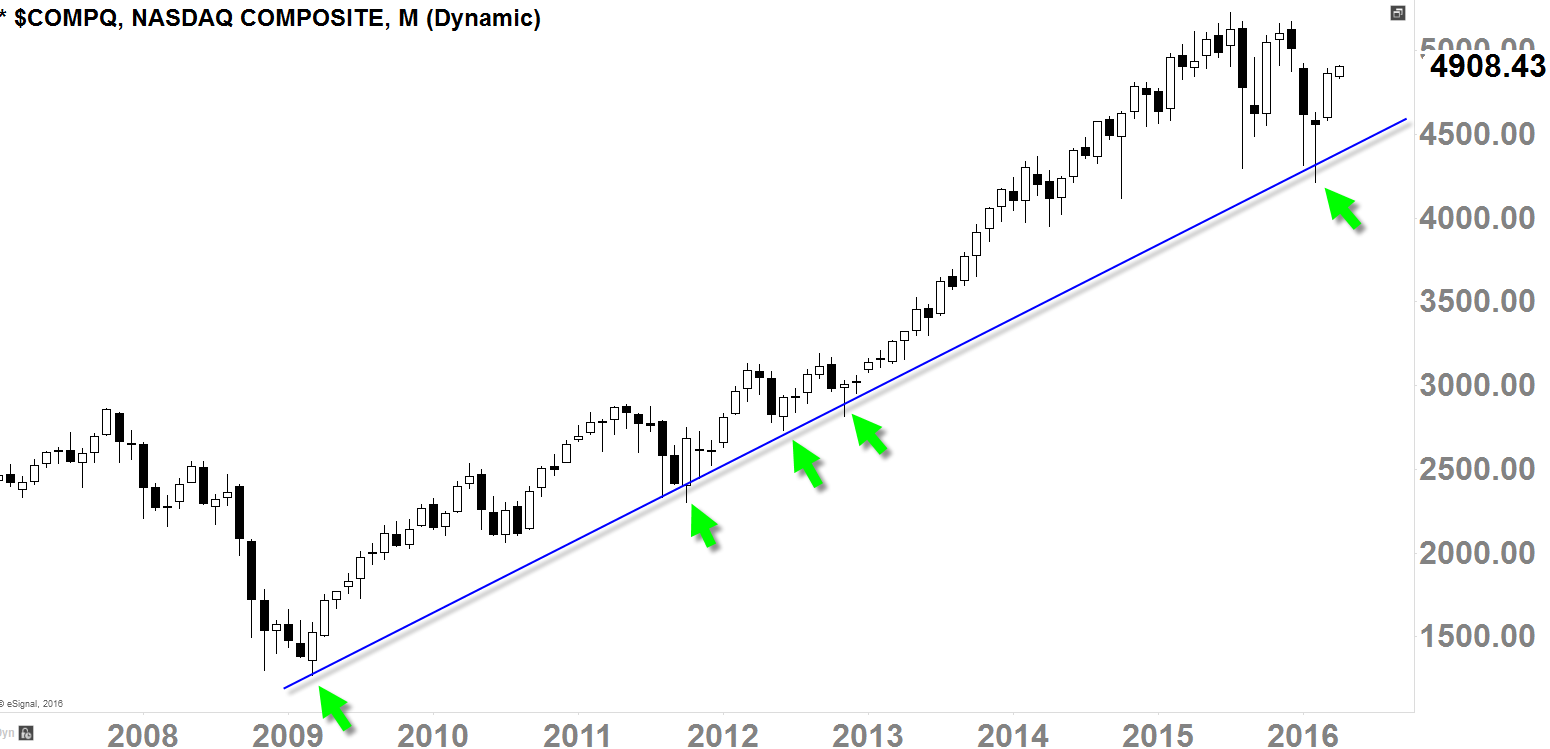
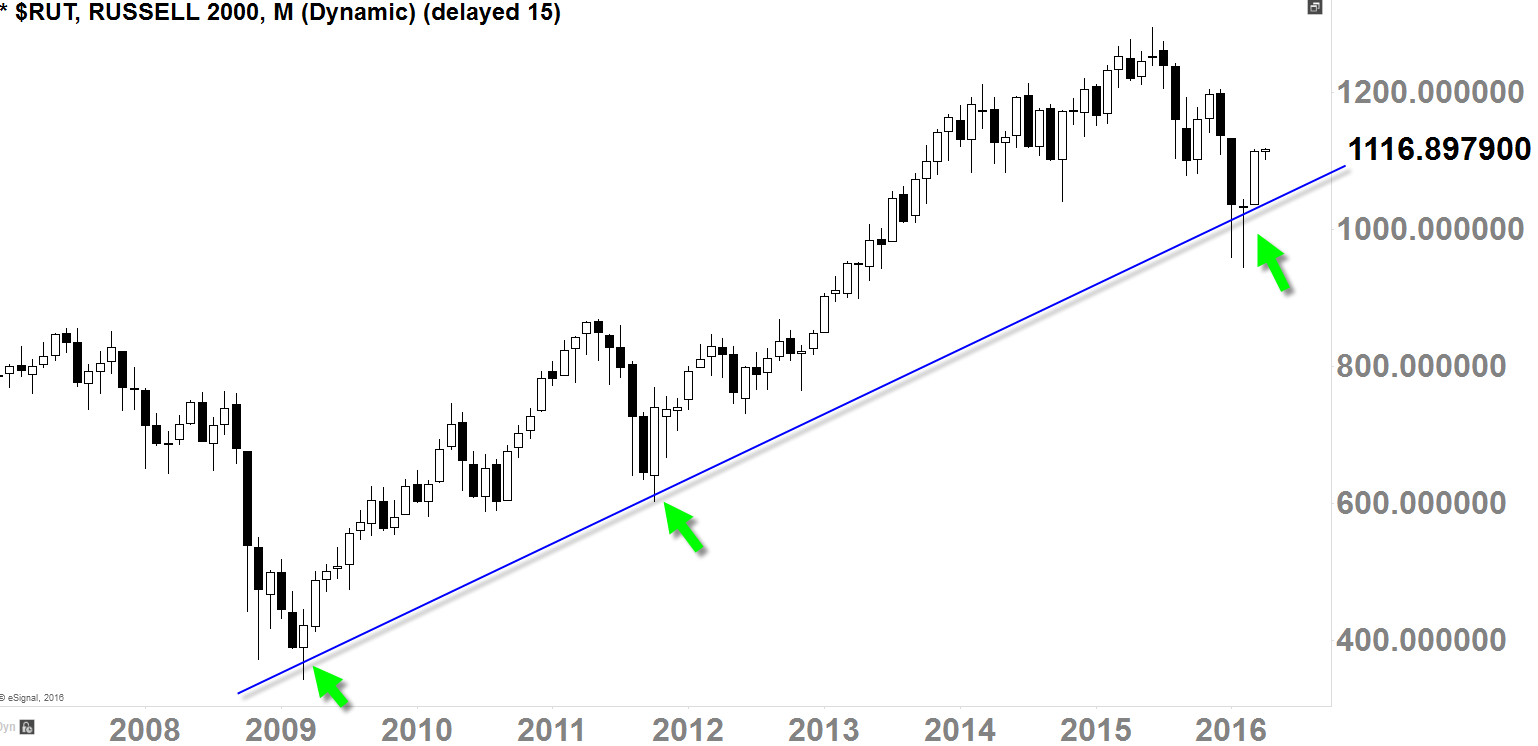
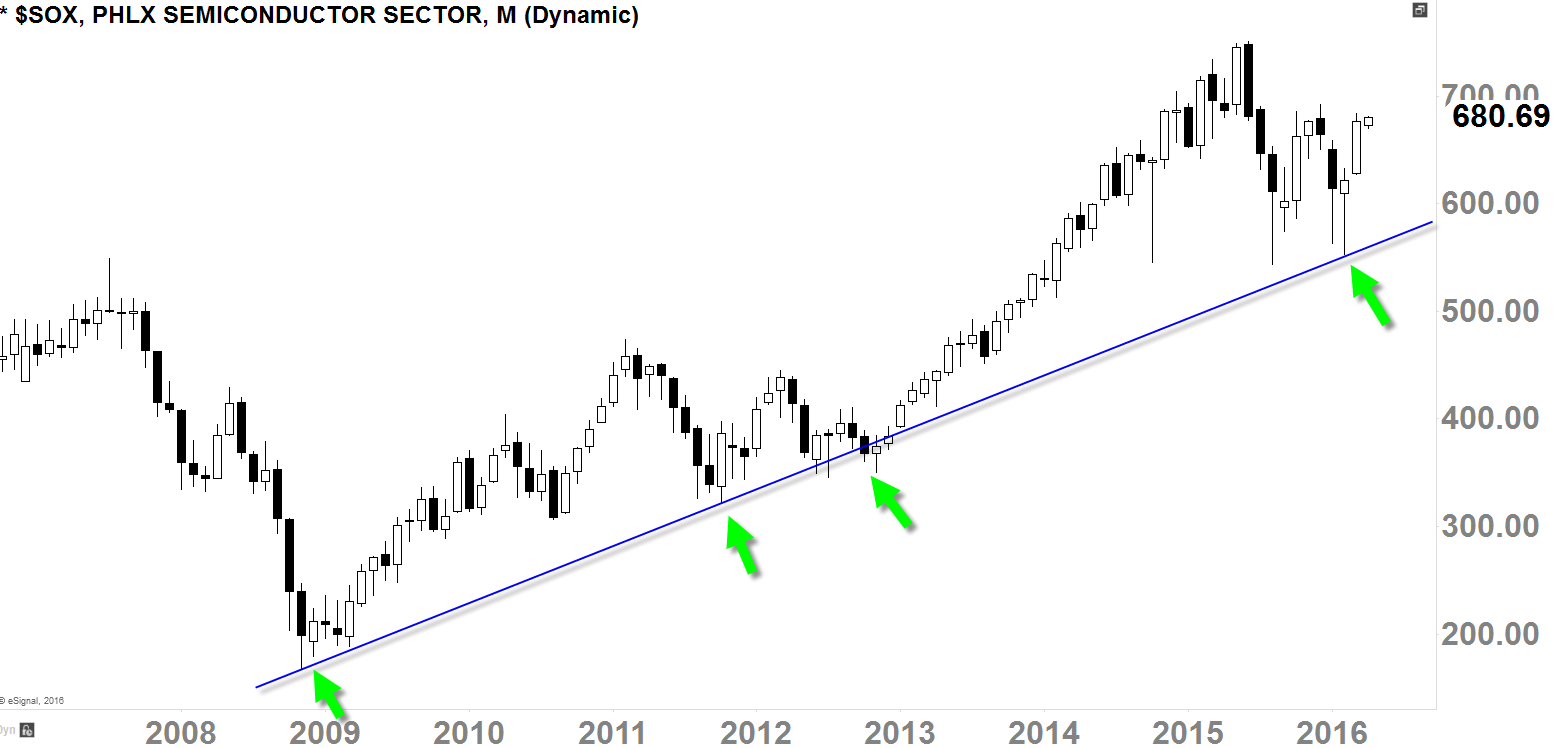
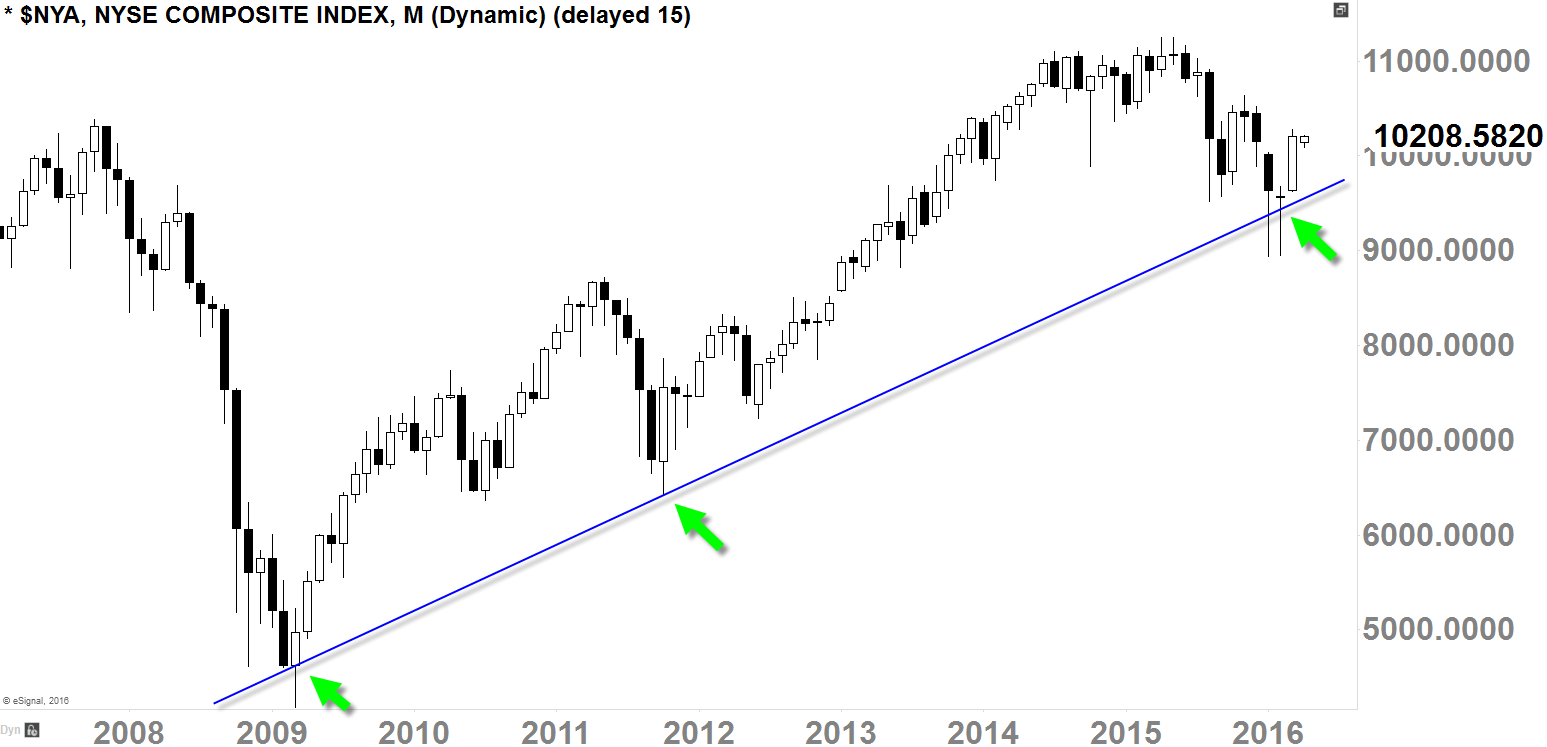
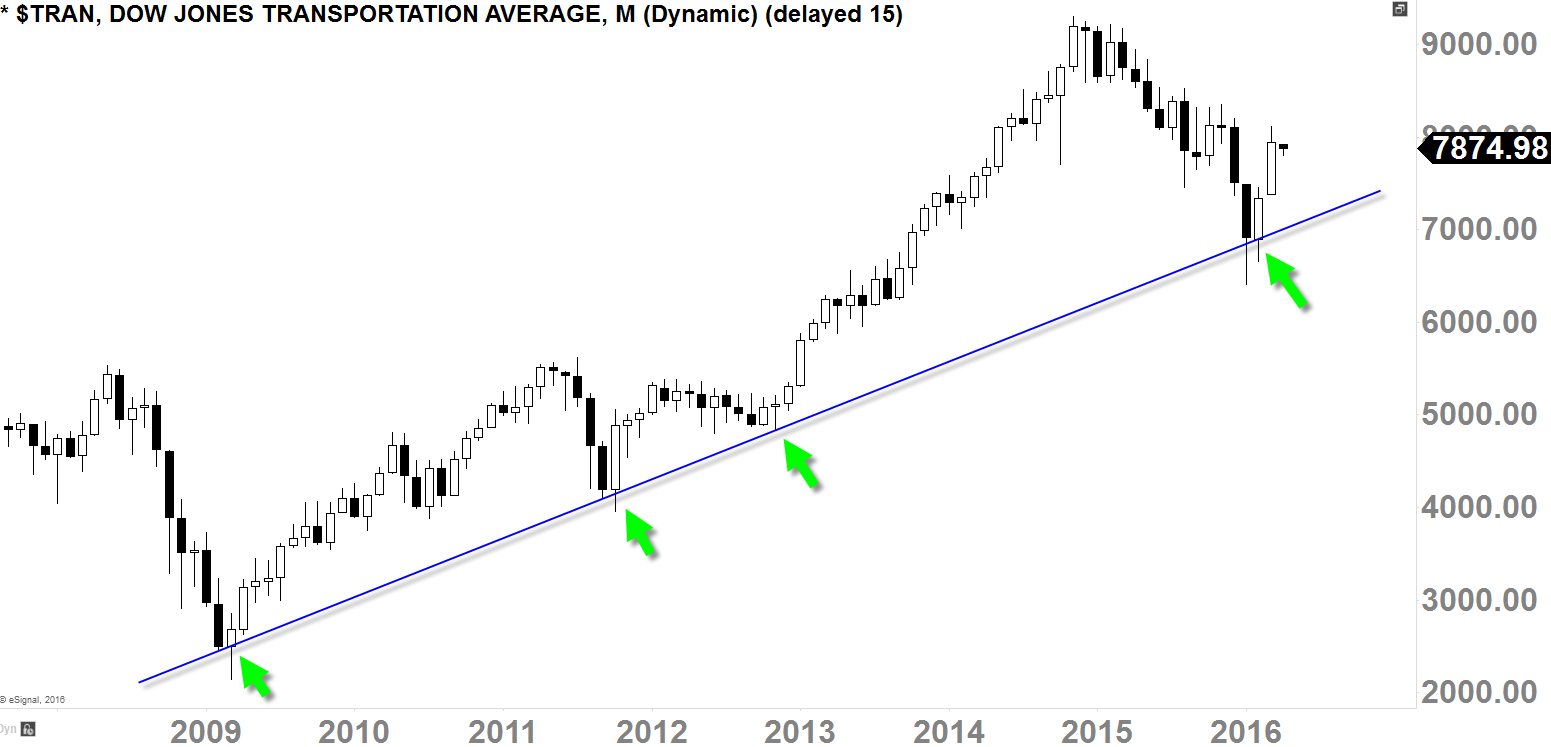
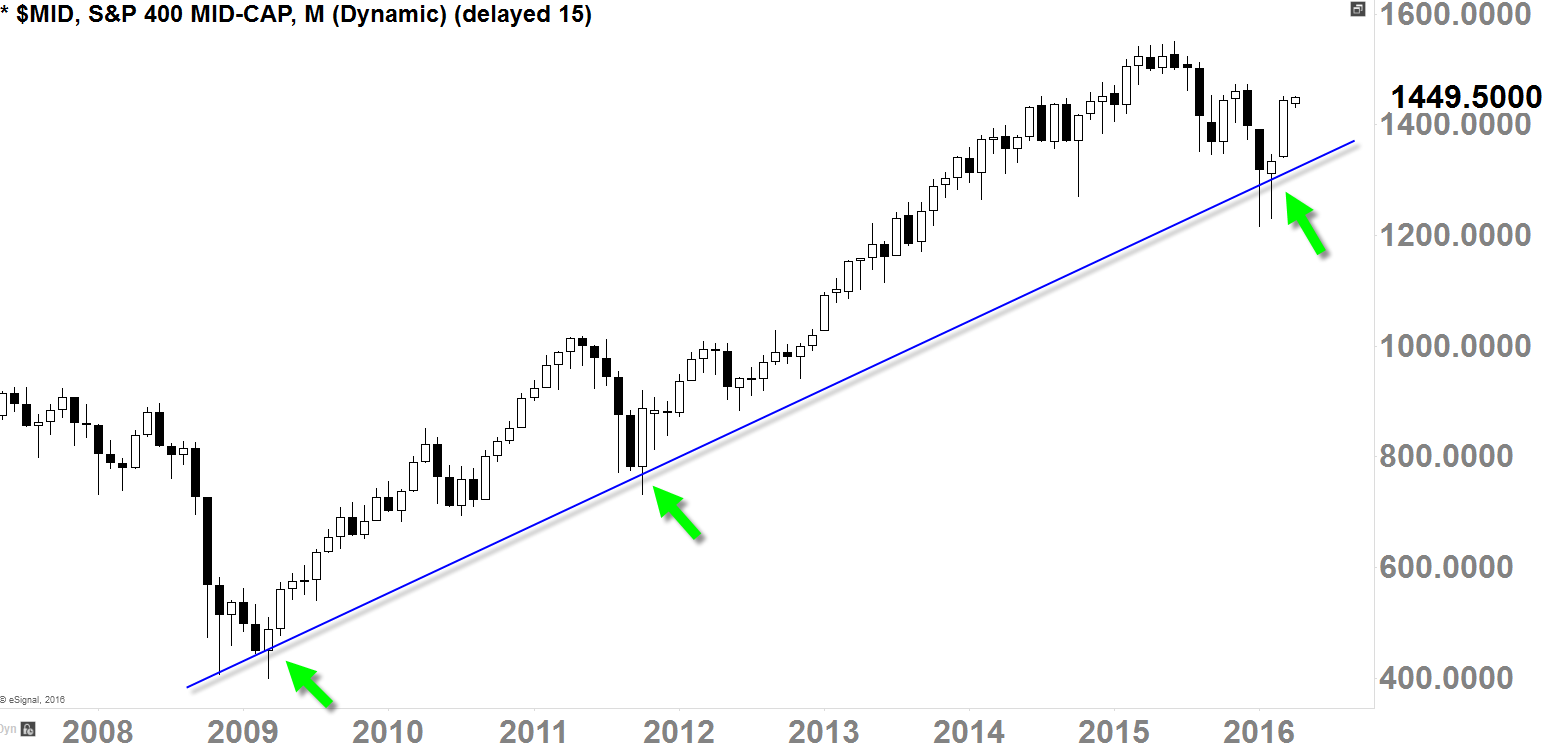
So many traders and investors believe that we are in a downtrend, but technically speaking (as I will be showcasing the charts in this post) we are not currently in a downtrend.

In fact, we are STILL in an uptrend with sideways action since 2015; this means, benefit of the doubt still goes to the buyers in the grand scale. This major primary-term uptrend is important, because, in the event that the market makes new highs, it will mean that the market has always been in an uptrend (see my last video commentary on this).

Therefore, these charts are extremely important for long-term traders/investors and also to intermediate-term traders as well.

I also want to add that there are still levels the buyers need to overcome in the intermediate-term before we come to a conclusion that the market is ready to make new all-time highs.

Current sentiment could change quickly from bullish to bearish as we have been dealing with that kind of market this whole year, so when the market shakes, big picture perspective will help us to gauge.

Dow Jones Industrial Average
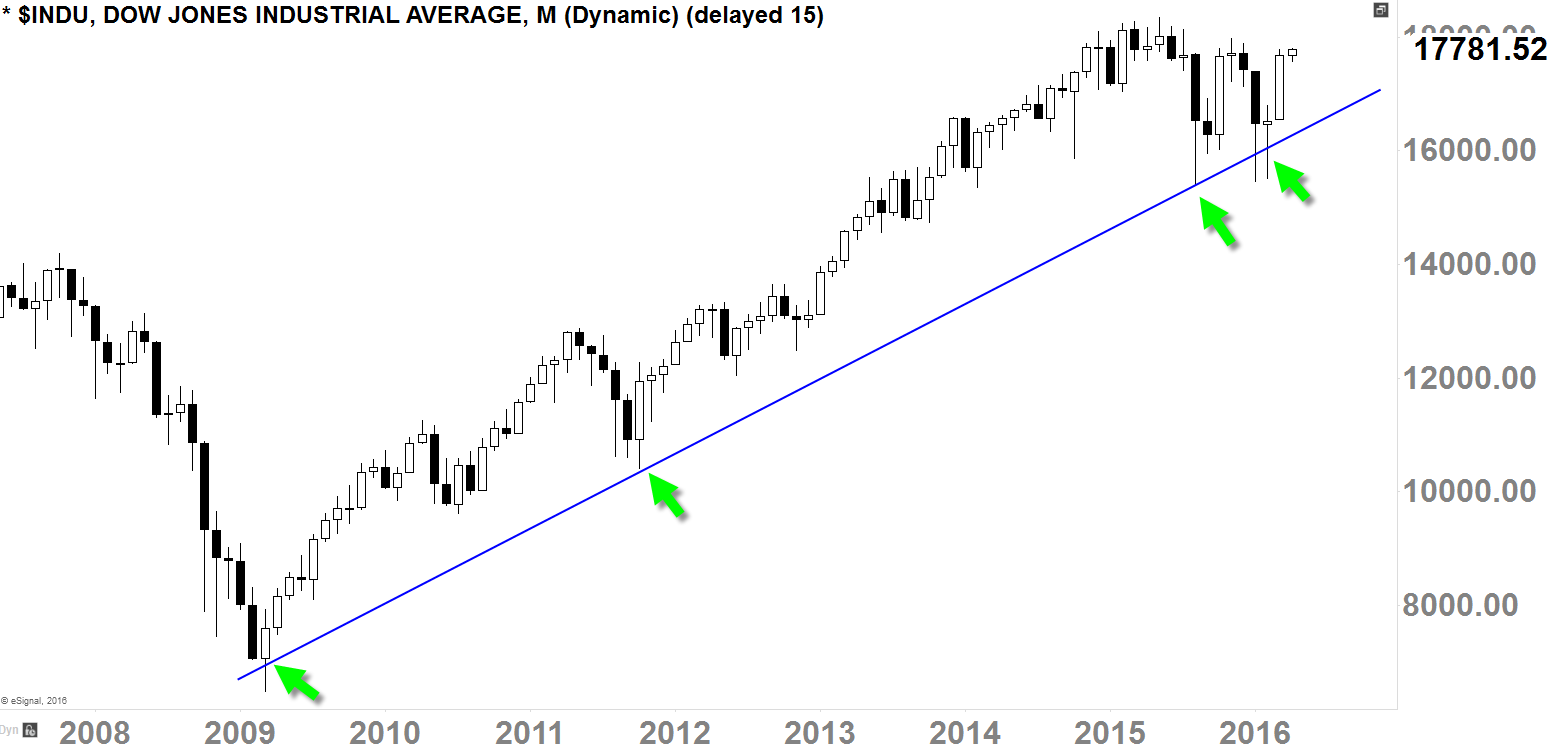
INDU Monthly 2008-2016

S&P 500 INDEX

SPX Monthly 2008-2016

NASDAQ Composite

COMPQ Monthly 2008-2016

Russell 2000

RUT Monthly 2008-2016

Philadelphia Semiconductor Index

SOX Monthly 2008-2016

NYSE Composite

NYA Monthly 2008-2016

Dow Jones Transportation Average

DJT Monthly 2008-2016

S&P Midcap 400

MID Monthly 2008-2016

Financial Select Sector SPDR (NYSE:XLF)
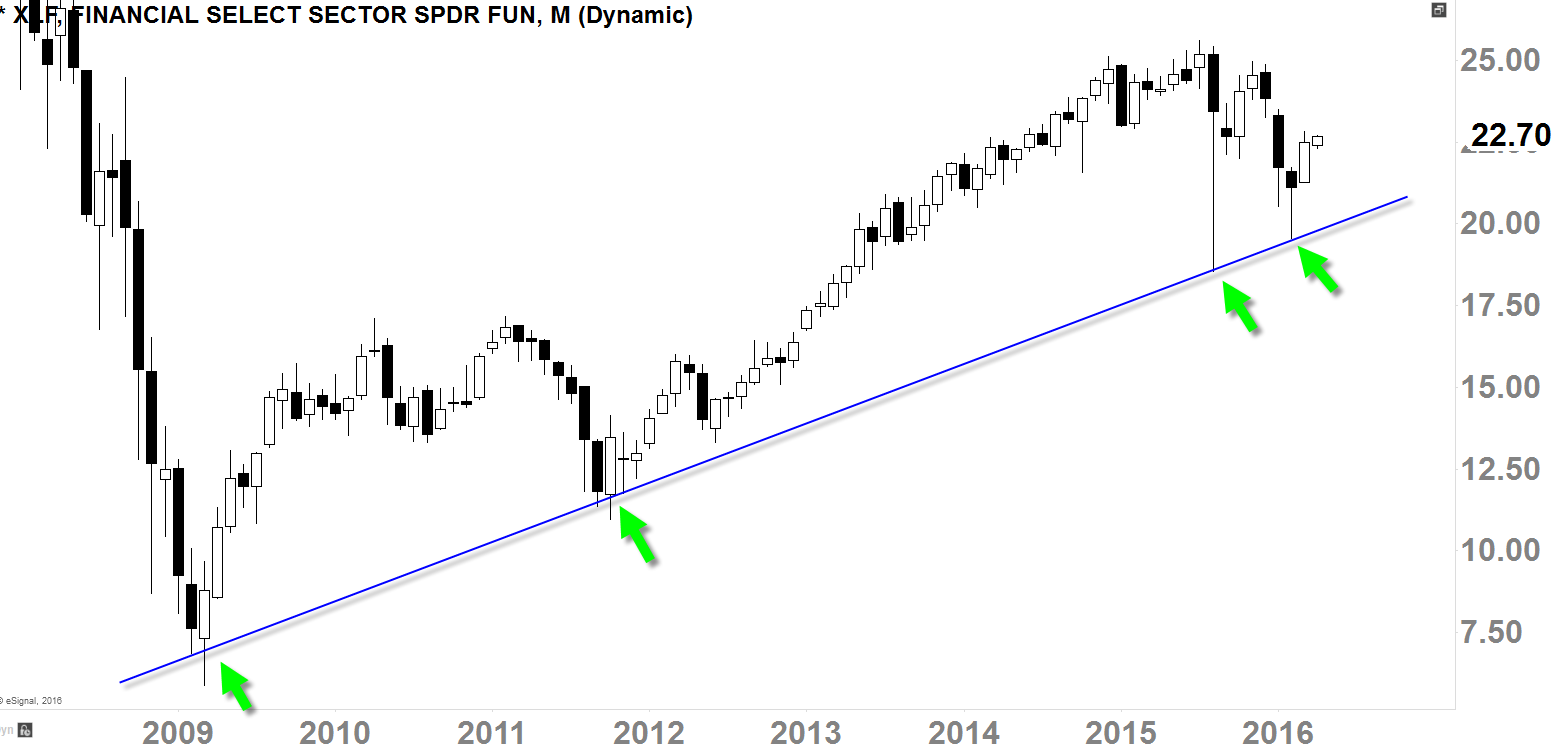
XLF Monthly 2008-2016

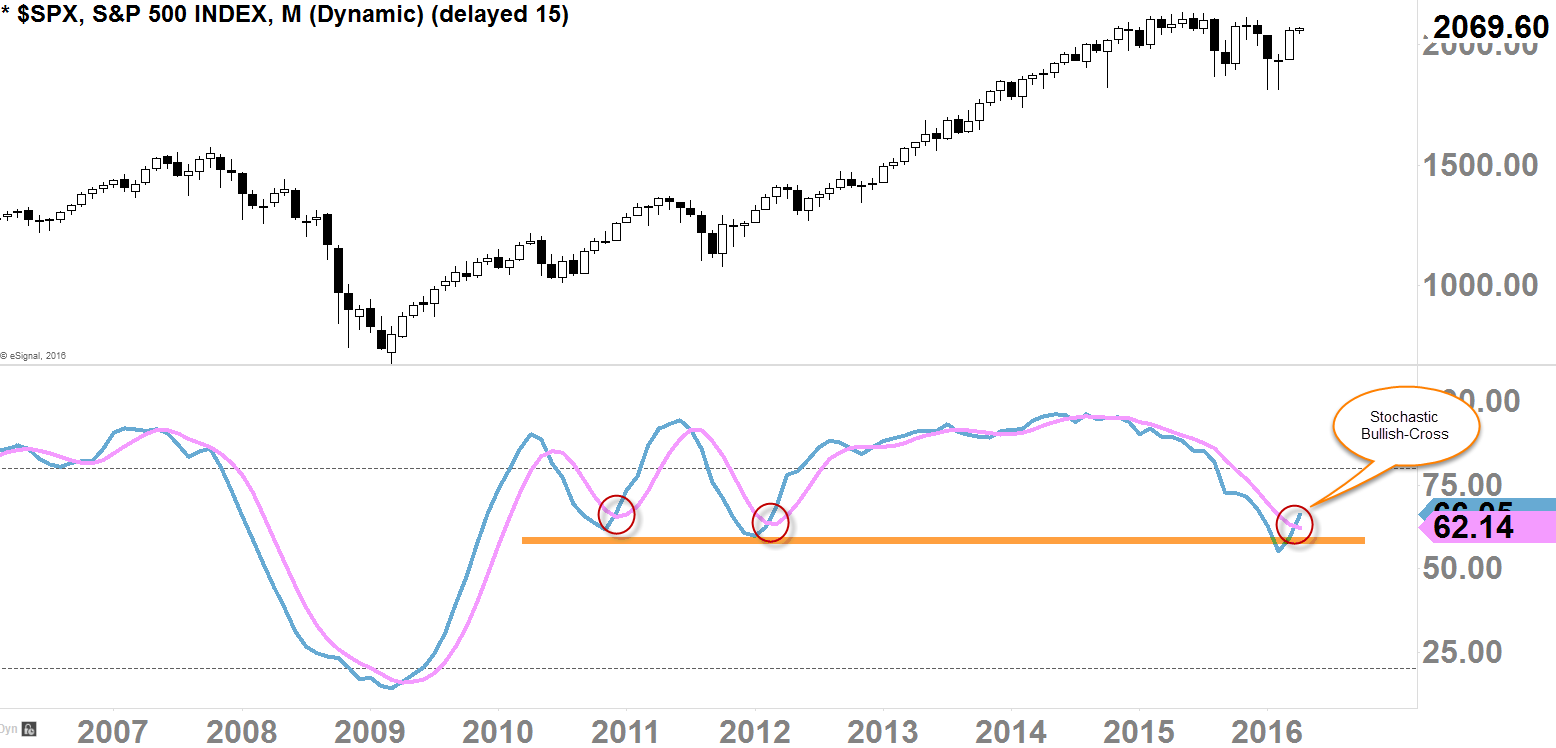
*BONUS CHART*

SPX Monthly 2006-2016

Latest comments

Risk Disclosure: Trading in financial instruments and/or cryptocurrencies involves high risks including the risk of losing some, or all, of your investment amount, and may not be suitable for all investors. Prices of cryptocurrencies are extremely volatile and may be affected by external factors such as financial, regulatory or political events. Trading on margin increases the financial risks.
Before deciding to trade in financial instrument or cryptocurrencies you should be fully informed of the risks and costs associated with trading the financial markets, carefully consider your investment objectives, level of experience, and risk appetite, and seek professional advice where needed.
Fusion Media would like to remind you that the data contained in this website is not necessarily real-time nor accurate. The data and prices on the website are not necessarily provided by any market or exchange, but may be provided by market makers, and so prices may not be accurate and may differ from the actual price at any given market, meaning prices are indicative and not appropriate for trading purposes. Fusion Media and any provider of the data contained in this website will not accept liability for any loss or damage as a result of your trading, or your reliance on the information contained within this website.
It is prohibited to use, store, reproduce, display, modify, transmit or distribute the data contained in this website without the explicit prior written permission of Fusion Media and/or the data provider. All intellectual property rights are reserved by the providers and/or the exchange providing the data contained in this website.
Fusion Media may be compensated by the advertisers that appear on the website, based on your interaction with the advertisements or advertisers.
© 2007-2024 - Fusion Media Limited. All Rights Reserved.