In Part 1 and Part 2 I spelled out the historical record of a relatively simple system that uses seasonal trends in the stock market (along with a moving average filter) to decide when to be in or out of the stock market.
Now if my sole intention was to pump up the system and pretend I am some kind of genius I would simply point out that since 1934 a Buy-and-Hold approach has gained 2,822%, while the Seasonal System I detailed gained +33,747%, or +15.8% annually (not including any dividends).
Or I might be more confrontational and ask simply, “How many systems do you know of with an 80-year track record as good as this one?”
But alas, my enthusiasm for being a smug jerk is tempered only by the knowledge that “having a trading system and actually trading said system is not the same thing.” Anyone can come up with a set of trading rules that generate decent results over time. But the real question is “can you follow your trading rules day in and day out” and generate the results you expect? Or to put it another way, note:
Jay’s Trading Maxim #17: When it comes to trading, between theory and reality there can be a chasm a mile wide.
(See also Another Intentionally Scary Headline – but Still Worth a Read)
One Approach to Trading Using Seasonals
As always, I am not advocating that you trade in the manner I am about to describe. The purpose of this blog is “to provide information”. What you choose to do or not do with said information is – as my sweet Aunt would say “entirely up to you” (Or as my not so sweet Uncle would say, “ain’t my problem.”)
The basic idea is to:
A) Trade the Dow Industrials using leverage when the KTI is +5 or greater and;
B) To trade the Dow Industrial without using leverage if:
1) the KTI is between +2 and +4 AND,
2) the Dow is above its 200-day moving average.
C) Otherwise the system holds cash.
Pretty straightforward and can be accomplished using the following ETFs:
*Dow (no leverage) = Ticker DIA
*Dow (2-to-1 leverage) = Ticker DDM (ARCA:UDOW)
With mutual funds it’s a little trickier because neither ProFunds nor Rydex offers a straight non-leveraged Dow fund (although they do both offer a leveraged Dow fund and a leveraged S&P 500 Index fund).
Whether to use ETFs or mutual funds is up to each individual investor. For this strategy I will mention two things in favor of mutual funds:
A) You can invest exact dollar amounts. For example, if you have $6,982 to invest in an ETF you have to divide $6,982 by the price of one share and figure out how many shares you can buy. With a mutual fund you can buy $6,982 worth of shares.
B) In most cases you will pay a commission when you buy or sell the shares.
So for illustrative purposes, I am going to go with the following portfolio:
*When KTI >= +5 buy and hold ticker UDPIX (ProFunds UltraDow 30)
*When KTI = +2, +3 or +4 AND Dow Jones Industrial Average > its own 200-day moving average hold ticker BLPIX (Bull ProFund which tracks the S&P 500 Index using no leverage)
*When KTI < +2 OR if KTI = +2, +3 or +4 AND Dow Jones Industrials Average < its own 200-day moving average, hold cash.
Results
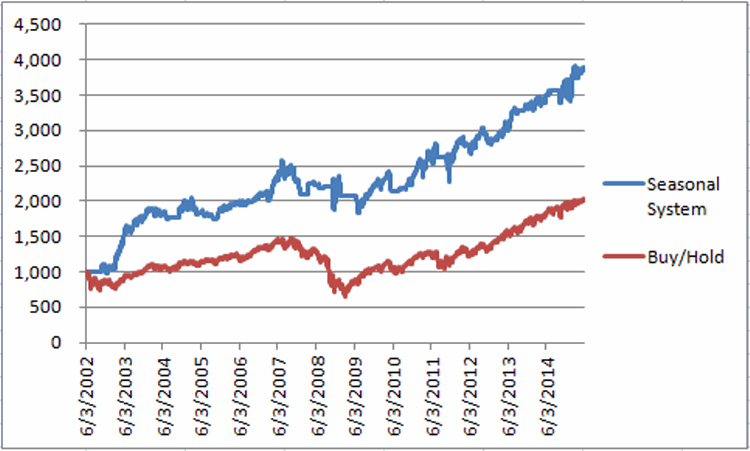
Figure 1 displays the growth of $1,000 invested using this system using UDPIX and BLPIX versus the growth of $1,000 invested in ticker BLPIX on a buy-and-hold basis. The test dates are 6/3/2002 (when UDPIX started trading) and 5/29/2015.
Figure 1 – Growth of $1,000 trading Seasonal System using UDPIX and BLPIX (blue line) versus buying and holding BLPIX (red line); 6/3/2002-5/29/2015.
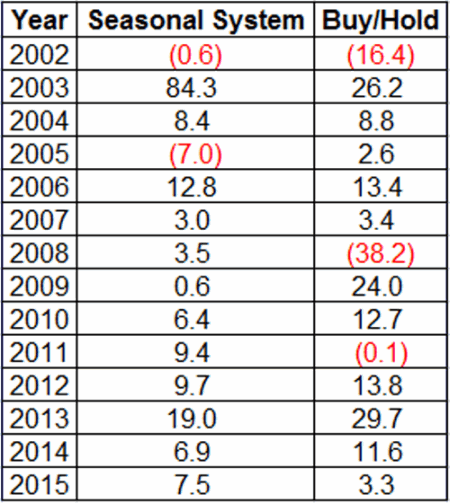
At first glance the results seem pretty clearly in favor of the Seasonal System. $1,000 invested using the system grew to $3,894 versus just $2,024 for a buy-and-hold approach. Figure 2 displays the year-by-year results for the two methods.

Figure 2 – Annual Results: Seasonal System versus Buy and Hold.
A few key things to note:
*The Seasonal System was down between June of 2002 (when UDPIX started trading) and the end of the year. It was also down in 2007. Other than that the system:
*Is working on its 10th consecutive winning year
*Has been up 9 of the past 11 calendar years
*Actually managed to post a gain during the disastrous year of 2008
So has it been consistently profitable? Yes.
Has it outperformed buy-and-hold? Yes.
But maybe you remember my comment in Part 1 that this is a “long-term’ system – and that did not refer to “holding period” but rather to “commitment level”. In other words, an investor using this system needs to focus on 10-year returns and not year-to-year fluctuations (As I mentioned in Part 2, using the Dow Industrial Average, the system has outperformed buy-and-hold during 70 of 71 ten year periods since the end of 1944). The reason for this becomes more evident when one takes a closer look at Figure 2.
While the Seasonal System has made money consistently the annual numbers are not eye-popping. In a nutshell this system outperforms over the long term by:
A) Grinding out positive (albeit at times not spectacular) results during bull markets and;
B) By not getting killed in bear markets.
Not everyone is suited to “grind it out” trading. It requires discipline to keep making the trades even if – or perhaps I should especially if – results have only been fair to middling for an extended period of time. And it also requires a fair amount of “faith” to keep believing that “grinding it out” will ultimately pay off. Which leads up to:
Jay’s Trading Maxim #9: The fact of the matter is that there are lots of trading methods that work well. The trick is finding one that works well for you.
The Rest of 2015
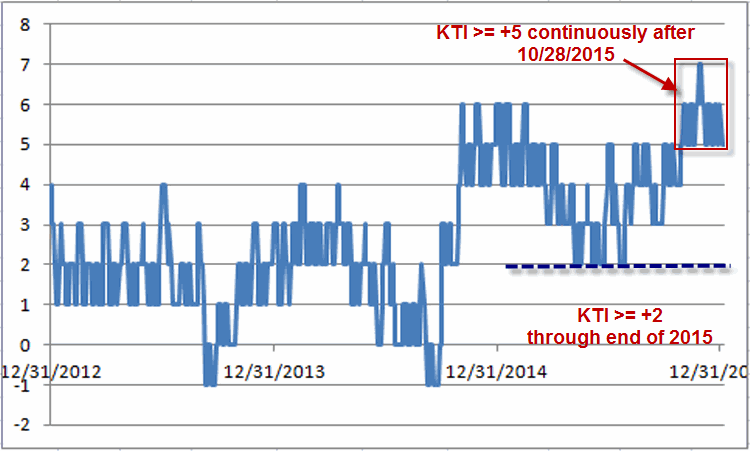
Figure 3 displays the KTI readings through the end of 2015.
Figure 3 – Daily KTI Readings through 12/31/2015.
Key things to note:
1) There are a few days in June, July, August and September that will read +5 (i.e., leverage will be used on those days).
2) After 10/28 through 12/31 ALL days will be +5 or higher. So we will look for (OK, hope for) bullish market action then as leverage will be used through all of November and December.
3) ALL days between now and the end of the year will read +2 or higher. This means that as long as the Dow remains above it’s 200-day moving average a long position will be held throughout.
4) Remember that +5 or higher days are long using leverage REGARDLESS of whether the Dow is above or below its 200-day moving average.
5) KTI +5 or higher dates through 12/31/15 (the system as detailed above will be long ticker UDPIX on these dates regardless of whether the Dow Industrials Average is above or below its 200-day moving averge.
*6/30/15 through 7/7/15
*8/13/2015 through 8/18/15
*8/28/15 through 8/31/15
*9/2/15 through 9/4/15
*11/2/15 through 12/31/15
Updates
Annual updates of the KTI Index will be available soon for a small fee. Look for an upcoming announcement.
Jay Kaeppel

