Get 40% Off
🚨 Volatile Markets? Find Hidden Gems for Serious OutperformanceFind Stocks Now

Uncle Sam’s Largest Asset Is Student Debt

Published 07/19/2015, 03:26 AM
Updated 05/14/2017, 06:45 AM

Financial-Assets

Most of the talking heads on TV are constantly focused on the federal government’s debt - which currently stands at a stunning $17 trillion.

But what about assets? Who is talking about the largest (positive) line item on Uncle Sam’s balance sheet?

We are. Because for those who know how to spot it, there is huge profit potential...

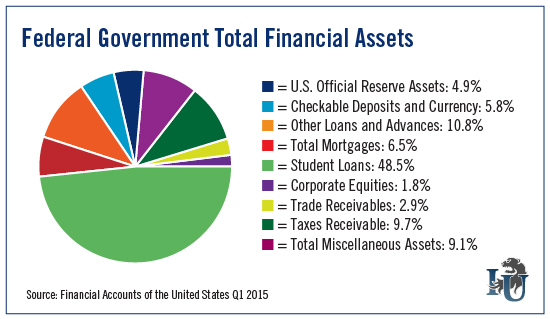
In this week’s chart, we lay out Uncle Sam’s total financial assets. And as you can see, student loans make up 48.5% of the pie.

This is five times larger than Taxes Receivable, which clocks in at just 9.7%.

Now we have arrived at something the media actually has been squawking about: our rapid growth in student debt.

It’s astounding. Since the Great Recession of 2007, the federal government’s student loan balance has risen 662%. Today, total student loan debt is around $1.16 trillion. That is more than four times the size of Greece’s gross domestic product.

This is good news for Uncle Sam, sure, but horrible news for graduates and their families. Nowadays, student debt averages $29,000 per person. So it’s no surprise that student loan forgiveness has become such a hot topic.

We could entertain the classic debate between good and bad debt - something our Editorial Director Andrew Snyder touched on earlier this year - but let’s instead focus on the opportunity...

Student loan stocks.

SLM Corporation (NASDAQ:SLM), better known as Sallie Mae, and Nelnet Inc (NYSE:NNI) are two of the top student loan servicing companies in the country.

3rd party Ad. Not an offer or recommendation by Investing.com. See disclosure here or remove ads .

Both stocks have seen strong growth as student loans balloon to new heights.

Over the last five years, SLM and Nelnet have seen their stocks gain 164.78% and 154.68%, respectively. During the same period, the S&P 500 has returned 112.56%.

These market-beating returns have a lot to do with both companies raking in huge profits. Since 2010, Sallie Mae has seen average earnings-per-share (EPS) growth of 17.16% per year. Nelnet has averaged EPS growth of 8.51%.

I mentioned above that student loan debt is around $29,000 per graduate. Meanwhile, median starting salaries for graduates today average $46,000. Think that’s bad? By 2023, median salaries are expected to be equal to outstanding loans.

Bad news for students? Absolutely. But it’s great news for educational lending stocks. Based on these figures, Sallie Mae and Nelnet are all but assured to continue their upward climb.

As for the public side... don’t be surprised to see student loans dominate more than 50% of Uncle Sam’s assets by year end.

Latest comments

Sallie Mae no longer services loans. They spun this division out along with other portions of the business, under the brand "Navient" which trades under NAVI on NASDAQ. Sallie Mae only issues private student loans now. You need to update all analysis to reflect this change, as past Sallie Mae results need to be parsed into contribution from the two core sectors - loan holdings and loan services - to reflect the comparison with Nelnet and projections about future potential based on the federal student loan servicing contract, which Sallie Mae now has no involvement in whatsoever.
Risk Disclosure: Trading in financial instruments and/or cryptocurrencies involves high risks including the risk of losing some, or all, of your investment amount, and may not be suitable for all investors. Prices of cryptocurrencies are extremely volatile and may be affected by external factors such as financial, regulatory or political events. Trading on margin increases the financial risks.
Before deciding to trade in financial instrument or cryptocurrencies you should be fully informed of the risks and costs associated with trading the financial markets, carefully consider your investment objectives, level of experience, and risk appetite, and seek professional advice where needed.
Fusion Media would like to remind you that the data contained in this website is not necessarily real-time nor accurate. The data and prices on the website are not necessarily provided by any market or exchange, but may be provided by market makers, and so prices may not be accurate and may differ from the actual price at any given market, meaning prices are indicative and not appropriate for trading purposes. Fusion Media and any provider of the data contained in this website will not accept liability for any loss or damage as a result of your trading, or your reliance on the information contained within this website.
It is prohibited to use, store, reproduce, display, modify, transmit or distribute the data contained in this website without the explicit prior written permission of Fusion Media and/or the data provider. All intellectual property rights are reserved by the providers and/or the exchange providing the data contained in this website.
Fusion Media may be compensated by the advertisers that appear on the website, based on your interaction with the advertisements or advertisers.
© 2007-2024 - Fusion Media Limited. All Rights Reserved.