Forex News and Events:
The softness in UK inflation figures triggered a short-lived price action in GBP trading this morning. The Cable rebounded from a week low, EUR/GBP shortly tested the 50-dma. While the knee-jerk market reaction didn’t damage key technical levels, the focus will remain on UK jobs data due tomorrow. EUR/USD tests the strong 1.3800 support, EUR-complex gives signs of weakness. The US will publish inflation numbers in the afternoon. A stronger reading should boost USD-bulls and further weigh on EUR/USD.
UK inflation softens
The UK headline CPI further eased to 1.6% from last month’s 1.7%. The weakness in consumer prices clearly gives the BoE the freedom to hold its forward guidance safely in place, as the inflation knock-out is not a concern anymore. The headline CPI trends down since 3.0% hit last June, and eases further below BoE’s 2% target since January. According to statistics office, the weakness in CPI is due to lower petrol, clothing and furniture prices. On the other hand, the house price inflation hit 9.1% in February, the fastest since June 2010 according to ONS.
GBP/USD spiked down to 1.6661 post-CPI as knee jerk reaction and bounced back to daily averages. GBP/USD trades slightly below the mid-range of Nov-Apr uptrend channel. Key short-term support is seen at 21 & 50 dma (1.6628/23). EUR/GBP shortly hit the 50-dma (0.82835) before extending daily losses. The first target stands at 0.82250 (April downtrend channel base), then 0.82042 (March 5th low).
The UK jobs data is due tomorrow and the average weekly earnings may have increased to 1.8% annually (vs. 1.4% in February). The same report is expected to show improvement in 3-months jobless rate from 7.2% to 7.1%. Despite expectations on UK jobs back to improving path, the option bets in GBP/USD are negatively skewed below 1.6750 for the week ahead. Technically, GBP/USD fluctuates in the mid-line of Nov’13-Mar’14 ascending trend. The first line of support stands at 21 & 50 dma (1.6624/1.6615). More bids should come into play at the trend bottom (1.6550).
EUR gives signs of weakness
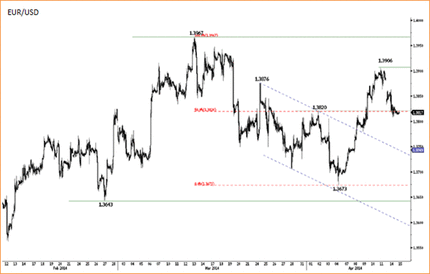
EUR/USD turns cautiously bearish; the ECB officials’ threat of QE has hard time to gain significant momentum. The pair tests bids at 1.3800 today, indicators signal a reversal in short-term trend to negative. However, traders’ reluctance to join the downside moves is plausible given the fragility of the bearish trend in EUR/USD over the past year. However, EUR/USD 2-month forward points hit the lowest since November 2011, meaning that investors see interest in hedging the downside in EUR versus USD. According to April 8th CFTC data, the speculative EUR long futures retreat for the third consecutive week, a total drop more than 50% since March 18th.
Technically, the bullish momentum loses pace, the MACD (12, 26) will step in the red zone for a daily close below 1.3750. At these levels, the first line of support is placed at 1.3781 (Fibonacci 61.8% on Feb-Mar rally). Option bets are skewed on the downside below 1.3800. The Euro-zone inflation figures are due tomorrow and should confirm the further softness in preliminary headline and core CPI readings (CPI y/y expected at 0.5%, CPI core at 0.8%). Will the softness in CPI readings lead to a concrete policy reaction from the ECB? Will the markets continue rejecting ECB’s QE threats? Will the EUR-bears remain subdued despite increase in ECB/Fed divergence? Released in the morning, the EZ trade surplus widened in February from EUR 13.9bn to EUR 15.0bn (SA), from EUR 0.8bn to EUR 13.6bn (NSA). According to Bank of France’s Noyer, the surplus in EZ’s trade balance naturally increases EUR demand, while the EZ’s domestic / import demand and credit growth are unable to generate enough liquidity to answer the demand in EUR. Naturally EUR appreciates. Is QE the solution?

Today's Key Issues (time in GMT):
2014-04-15T12:30:00 CAD Feb Manufacturing Sales MoM, exp 1.00%, last 1.50%2014-04-15T12:30:00 USD Apr Empire Manufacturing, exp 8, last 5.61
2014-04-15T12:30:00 USD Mar CPI MoM, exp 0.10%, last 0.10%
2014-04-15T12:30:00 USD Mar CPI Ex Food and Energy MoM, exp 0.10%, last 0.10%
2014-04-15T12:30:00 USD Mar CPI YoY, exp 1.40%, last 1.10%
2014-04-15T12:30:00 USD Mar CPI Ex Food and Energy YoY, exp 1.60%, last 1.60%
2014-04-15T12:30:00 USD Mar CPI Core Index SA, exp 236.452, last 236.122
2014-04-15T12:30:00 USD Mar CPI Index NSA, exp 236.017, last 234.781
2014-04-15T13:00:00 CAD Mar Existing Home Sales MoM, last 0.30%
2014-04-15T13:00:00 USD Feb Net Long-term TIC Flows, exp $22.5B, last $7.3B
2014-04-15T13:00:00 USD Feb Total Net TIC Flows, last $83.0B
2014-04-15T14:00:00 USD Apr NAHB Housing Market Index, exp 50, last 47
The Risk Today:
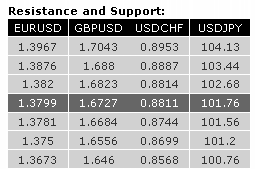
EUR/USD bearish momentum has stalled around support at 1.3820 (old resistance). Failure to find support here, followed by a clear break under 1.3820 (02/02/2014) region, will warn of a larger downside corrective phase to1.3673. In the longer term, EUR/USD is still in a dominate uptrend, suggesting additional upside can be anticipated. A significant resistance now lies at 1.3876 (24/03/2014 high).
GBP/USD strong bullish run was halted at key resistance 1.6823. Failure to break key level suggest a degree of exhaustion and suggests more further downside to 1.6684 (31/03/2013 high) then 1.6600 (7/04/2014). The short-term bullish momentum is intact as long as the hourly support at 1.6684 (previous resistance) holds. Another support lies at 1.6556. In the longer term, prices continue to move in a rising channel. As a result, a bullish bias remains favoured as long as the support at 1.6460 holds. A major resistance stands at 1.7043 (05/08/2009 high).
USD/JPY has broken the support at 102.68 (19/03/2014 high), leading to a sharp decline. Even though the support at 101.72 has been breached, prices are now close to a key support between 101.56 (see the rising trendline from 100.76 (04/02/2014 low)) and 100.76 (see also the 200 day moving average). A resistance now stands at 102.68 (previous support). A long-term bullish bias is favoured as long as the key support area given by the 200 day moving average (around 100.80) and 99.57 (see also the rising trendline from the 93.79 low (13/06/2013)) holds. A major resistance stands at 110.66 (15/08/2008 high).
USD/CHF has further recovered off 0.8744 (11/04/2014 low). Hourly resistance stands at 0.8814 01/04/2014 pivot low). However, the dominate bearish momentum suggests a challenge to key support at 0.8699 (13/03/14). From a longer term perspective, the structure present since 0.9972 (24/07/2012) is seen as a large corrective phase. The recent technical improvements suggest weakening selling pressures and a potential base formation. A decisive break of the key resistance at 0.8930 would open the way for further medium-term strength.

