As March posted its final closing print for the S&P 500 (at over 1,880), the equity market participants celebrated five year bull market anniversary (from March ’09 to March ’14). Ironically, majority of them most likely missed the first few years and have been pilling into the trend as of late. How typical. Conversely, I feel that the opposite course of action might be prudent and here are just a few simple reasons why.
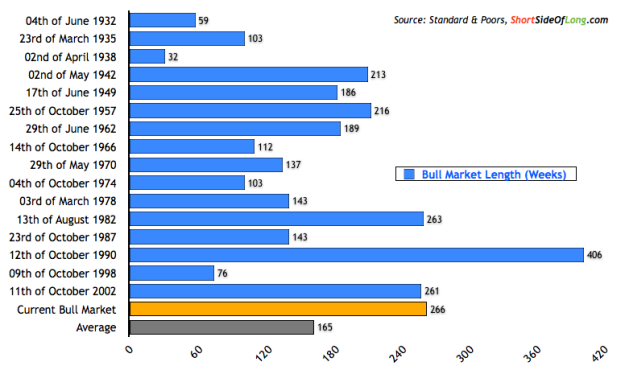
Chart 1: This is the second longest bull market in the 80 year history
Source: Short Side of Long
According to historical data, the current US equity bull market is the second longest in the last 80 years and third longest in a 100 year history (as the roaring 20s hold close similarities to the roaring 90s). As we can see in Chart 1, over the last several weeks, the current bull market has edged out the infamous 1982-87 and 2002-07 bull markets in terms of length.
A keen student of historical market trends should be able to observe that each and every prolonged bull market (which builds financial and economic excesses) does not usually end with mild correction, but rather serious market re-pricings. In other words, just as majority of the retail investors are becoming confident with stock investing once more (slowly forgetting the lessons of 2008), history shows us that risk increases substantially as the trend ages. Consider the following:
- 1920s bull market lasted 8 years and crashed by almost 90%
- 1980s bull market lasted 5 years and crashed by 40%
- 1990s bull market lasted almost 8 years and eventually crashed by 50%
- 2000s bull market lasted 5 years and crashed by 50%
I am not necessarily predicting another monster crash, but what I am trying to put forward is the notion thatthe longer the bull market goes on for, the higher the excesses become and the more painful the clean out could be on the other side.
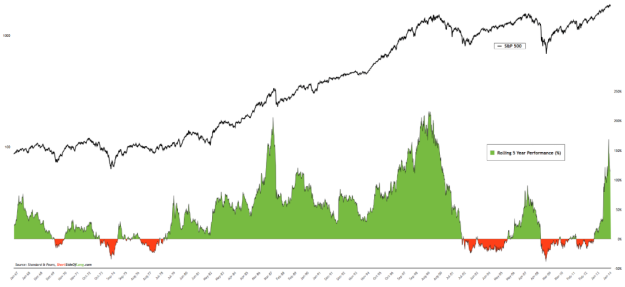
Chart 2: Annualised return over 5 years has been 3rd best in half century
Source: Short Side of Long
As we focus away from the bull market length, and towards the gains achieved, we can see that the current bull market gains also hold very close similarities to previous long bull markets discussed in Chart 1. The chart above shows the 5 year rolling performance for the S&P 500, where gains have now spiked above 170% for only the third time since the 1960s. The first two were into 1987 and 2000 market peaks.
The market has gifted investors one of the best 5 year return periods in half a century and history shows us that such periods do not last forever. In a recent article, Bloomberg described the current bull gains through “annual compounded returns” over 5 years. The article states that S&P 500 has:
…generated total returns for U.S. investors of 25 percent a year since the bull market began on March 9, 2009. The rally compares with 27 percent annually during the last five years of the technology bubble, a period when the S&P 500 gained 233 percent and $9.3 trillion of equity value was created, data compiled by Bloomberg show.
The S&P 500 Equal Weight Index, which strips out biases related to market value, has added more than 29 percent a year in the current run. That’s almost twice as much as in the last half of the Internet bubble, data compiled by Bloomberg show.
I find it ironic that in 2014, majority of Wall Street investment bank research notes state that the current bull market might replicate the gains seen during the late 90s tech bubble… all we have to do is keep buying stocks into the next few years. I guess anything is possible (yes, one day even pigs might fly), but the truth is that the market has already replicated the tech boom by gifting investors 25% annualised returns (including dividends) over the last 5 years.
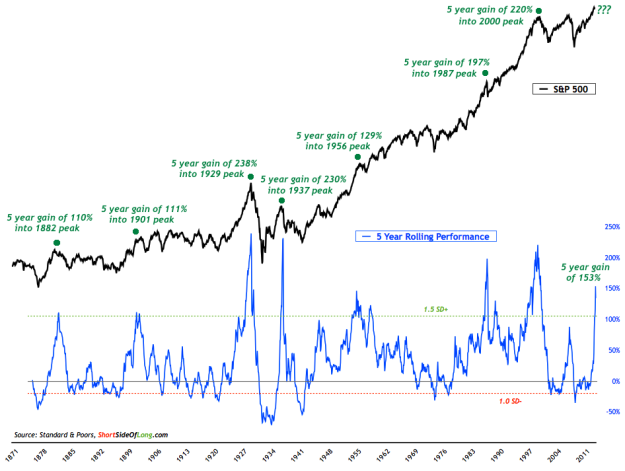
Chart 3: This fifth strongest 5 year performance in over 140 year history
Source: Short Side of Long
Instead of just looking at the market from 1960s to present, I took the 5 year rolling performance concept in Chart 2 and applied it to the last 140 years with Robert Shiller’s S&P data. The chart shows that gains in excess of 100% during the period of 5 years are 1.5 standard deviations above the historical mean.
Interestingly, including the current bull market, there have only been eight events in 140 year history where markets have gifted investors returns in excess of 100% over 5 years. These include gains into the peak of 1882, 1901, 1929, 1937, 1956, 1987, 2000 and 2014 (all marked on the chart above). Out of these eight, seven have led to serious corrections or outright crashes, while one (in 1956) lead to only a mild pull back. In all respect, the bull market in 50s was coming out of a Great Depression and extremely depressed stock valuations (refer to Chart 4).
Furthermore, we can see from the chart above, that it makes complete sense to buy equities when the rolling 5 year performance trends below 1 standard deviation away from the mean. Therefore, from the opposite perspective, it would also be outmost prudent to be cautious or even bearish during periods when the equity market trends 1.5 standard deviations above the 140 year historical mean.
After all, according to my own analysis, the market has only ever traded at these overextended levels 8.6% of the time or 143 months in the last 140 years. Mind you, outright majority of that was during the late 1990s tech bubble.
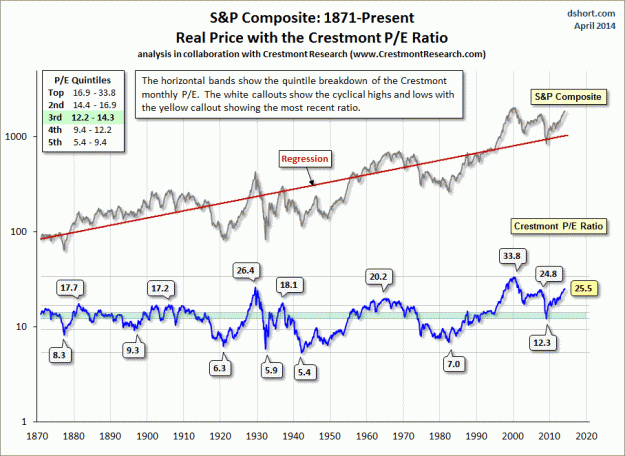
Finally, since I have already discussed various valuations before, I will not go into it again. However, it is worth stating that Chart 4 shows that this articles conclusion confirms overextended CAPE 10 and other valuation metrics. I believe the US equity market is in a dangerous spot right now.
Chart 4: Market is at 3rd most expensive level, beaten by 1929 & 2000!


