
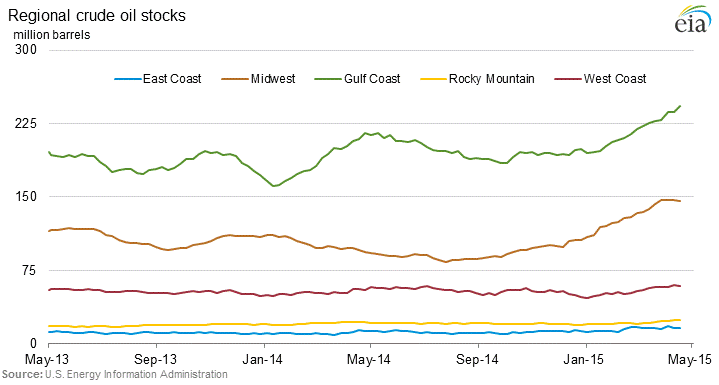
Oil Glut Build in PAD3 Gulf Coast
As expected, EIA today reported for week ending April 17, U.S. crude-oil inventories gained 5.3 million barrels to 489 million barrels, which is still the highest in at least 80 years, according to the EIA. Looking closer at each PAD region, almost all the inventory adds occurred in Gulf Coast PAD3; meanwhile, Cushing, OK added 738,000 barrels. Although 738,000 does not seem that bad by itself, Cushion is now is sitting at 62.2 million barrels of oil in storage (vs. a year ago inventory at 26 million barrels) , a new record high since April of 2004.
 |
| Source: EIA, week ending April 17, 2015 |
Gulf Coast Oil and Gasoline
The better news is that gasoline stockpiles fell 2.1 million barrels to 225.7 million barrels, the lowest level this year. Again, Gulf Coast accounts for almost all the drawdown in gasoline. Distillate stocks wereessentially flat rising by 395,000 barrels to 129.3 million barrels.
Products Export Demand Not As Robust
Since U.S. does not ban petroleum products export, the money trade is to move oil away from Cushing, which is the pricing point for NYMEX WTI, to lift WTI price, and into the refineries on the Gulf Coast converting to products like gasoline and diesel to be exported fetching higher prices.
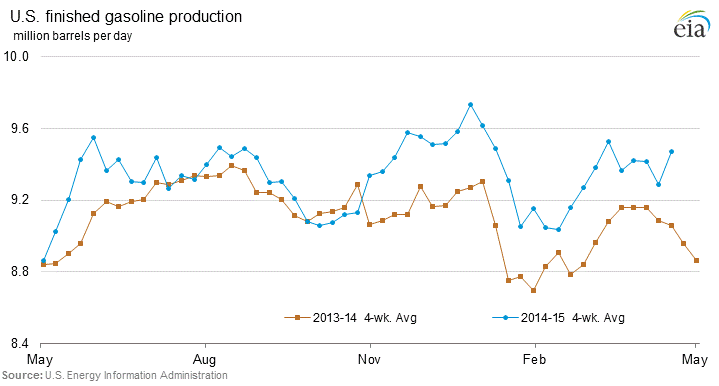
So it looks the new pipeline capacity around Cushing is doing its job moving oil glut from Cushing to Gulf Coast. EIA reported refining capacity utilization fell 1.1% to 91.2%, which is still quite high by historical standard. But judging from the flip flop between the crude and gasoline inventory numbers, the product export demand most likely has not been as robust as expected.
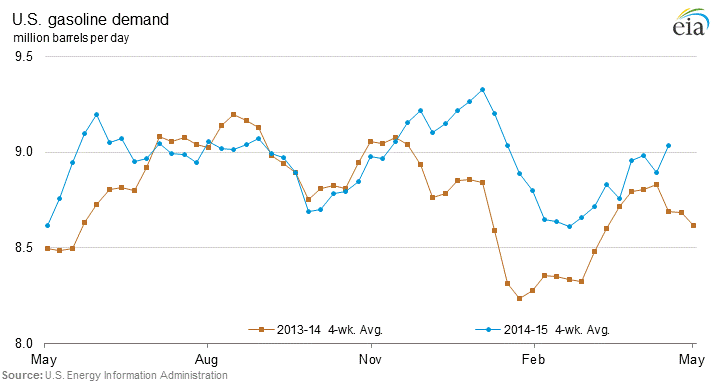
Domestic Gasoline Demand Rising
One bright spot is the rising gasoline demand. Although this is to be expected with the 'new normal' of ~ $50 oil, it nonetheless could suggest certain underlying strength of the U.S. economy.
How High Can You Go?
Right now the question is how high can oil inventory go? Oil market got a little bit encouragement when EIA reported a very slight production decline of 18,000 barrels a day. But that decline came from Alaska, while production in the Lower 48, where shale oil is, stayed unchanged.
For now, EIA still estimates that total U.S. crude oil production will fall by 57,000 barrels per day (bbl/d) in May. WTI closed at $56.33 while Brent was at $62.80 today. I think these prices are enough to get the shale E&Ps excited. Remember, many smaller E&Ps are starving for cash and need to produce just to cover interest expense and meeting payrolls. So we might actually see a halt or even a slight production drop as EIA predicted, but it may become short-lived if oil prices stabilize or go above current levels.